


https://dividendguy67.blogspot.com
A Dividend Portfolio - All Time High Profit Watermark

Just for informational purposes.
7 months ago, I thought it would be interesting one day, to show how a real life Malaysia dividend stock portfolio performs relative to KLCI benchmark. So, I started to keep track of my dividend portfolio's all time high profit watermark level. Unfortunately, it has to be done manually, since my online broker software cannot do this for me.
This portfolio originally comprised of at least 33 stocks of above average quality business, entered with at least 4% per annum dividend yield, most when its prices are generally lower than average, near my own definition of "accumulation zones" i.e. available at fairly attractive prices.
So, what this means is that after the start date, every time my dividend portfolio made a new all time high, I note the new high profit, the KLCI and the date. I didn't think I missed a day, but I cannot guarantee, and it's not audited.
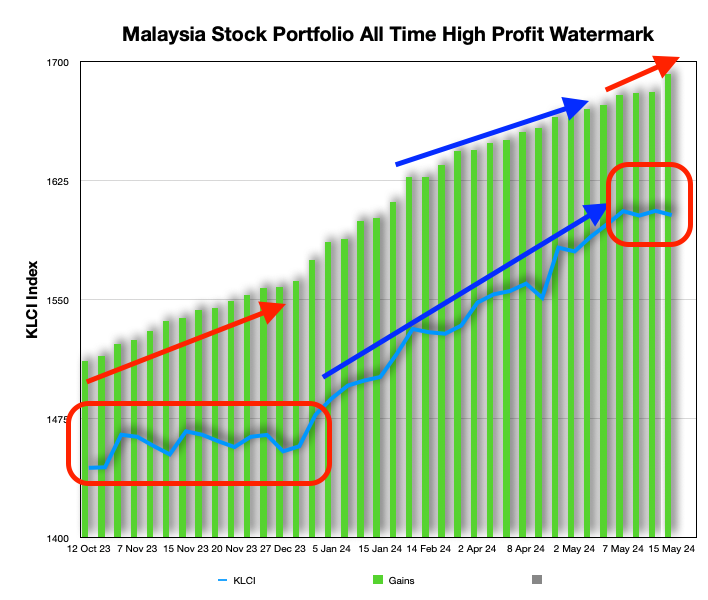
So, my tracking showed that this portfolio has made new all time highs of at least 37 times. The frequency is almost 25% i.e. roughly once every 4 days or so, it would make a new all time high again. It's clear the KLCI has been in a bull market.
The time gap between the 2 points varies.
- The shortest period between the last high and the next new high is 1 day.
- The longest period is 46 days so far.
- The quantum increase between 2 high watermark levels varies too.
A couple more observations.
1. The Red drawings is quite typical for a portfolio of good quality dividend stocks - when the KLCI index moves sideways in a box say, the portfolio continues to climb to make new highs, due to payment of regular dividends and the behaviour of prices to eventually return to previous levels (or higher) after dividend payment, for good businesses. This is the power of good quality stocks paying dividends.
2. The Blue drawings is also quite typical of a dividend portfolio, in that when the KLCI index climbs fast following the blue arrow, the portfolio grows too but at a slower rate i.e. it tend to lag behind. But for me, over this period, it still made returns higher than EPF by a margin.
The gains are enhanced slightly due to trading gains (I couldn't separate them out without a lot more work), but in general, the latter is relatively smaller, and so, even if I did the work to exclude trading gains, I don't expect that to change the overall picture of the above chart. Similarly, I also have a some small amount of profit taking and a small amount of rotation into better quality stocks available but I don't think it will change the shape of the picture above.
So, I'm very thankful and incredibly grateful to Mr Market and my dividend stocks! The overall performance met (and exceeded) my original investment objectives. I hope the past 7 months of manual tracking, just to create this chart, show something interesting, one that is typically observed over decades too and not just 7 months.
Best wishes!
More articles on https://dividendguy67.blogspot.com
Positioning your portfolio to hit new all time highs - Lessons from HLIND vs BAT
Created by DividendGuy67 | May 20, 2024
Discussions
Be the first to like this. Showing 0 of 0 comments
Post a Comment
Featured Posts

Apps


Top Articles
1
THE INVESTMENT APPROACH OF CALVIN TAN
NOTION, JCY & DUFU ARE STILL ON UPTRENDING MODE DUE TO REAL AND FUTURE EARNINGS, Calvin Tan
2
Good Articles to Share
North Korea sends more trash balloons to the South | REUTERS
3
Good Articles to Share
'GOOD OVER EVIL’: Jill Biden takes shot at Trump on ‘The View’ #shorts
4
Grand Mustah Trading Journey
The Under rated and unknown Data Centre related stocks in Bursa Malaysia
5
Good Articles to Share
6
Good Articles to Share
NJ bakery forced to make difficult decision under Biden's economy
7
Good Articles to Share
8
Good Articles to Share
Boeing Crisis: Plane Maker Will Need Years For Turnaround, Emirates’ Tim Clark Says
#
Stock
Score
Daily Stocks
Stock Name
Last
Change
Volume
Stock Name
Last
Change
Volume
Stock Name
Last
Change
Volume
MQ Trading Signals
Stock
Time
Signal
Duration
No trading signals available.
Stock
Time
Signal
Duration
No trading signals available.
Featured Advertisers / Partners


Ride The Bull Short The Bear
CS Tan
4.9 / 5.0
This book is the result of the author's many years of experience and observation throughout his 26 years in the stockbroking industry. It was written for general public to learn to invest based on facts and not on fantasies or hearsay....