


Icon8888 Gossips About Stocks
(Icon) SLP Resources - A Simple and Easy to Understand Plastic Packaging Company

Slp Resources Bhd (SLPR) Snapshot
|
Open
0.63
|
Previous Close
0.66
|
|
|
Day High
0.66
|
Day Low
0.63
|
|
|
52 Week High
11/7/14 - 0.76
|
52 Week Low
03/10/14 - 0.43
|
|
|
Market Cap
163.2M
|
Average Volume 10 Days
118.6K
|
|
|
EPS TTM
0.05
|
Shares Outstanding
247.3M
|
|
|
EX-Date
03/16/15
|
P/E TM
13.5x
|
|
|
Dividend
0.01
|
Dividend Yield
3.03%
|

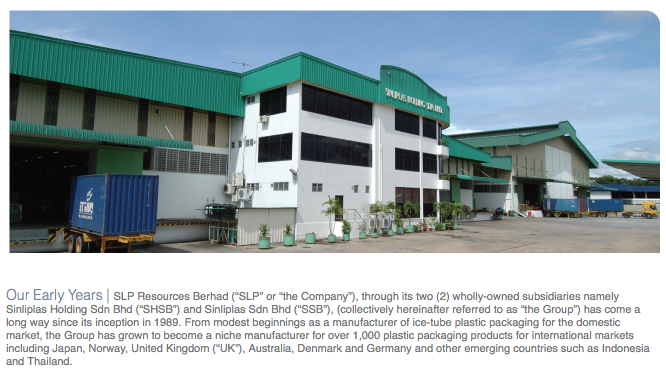
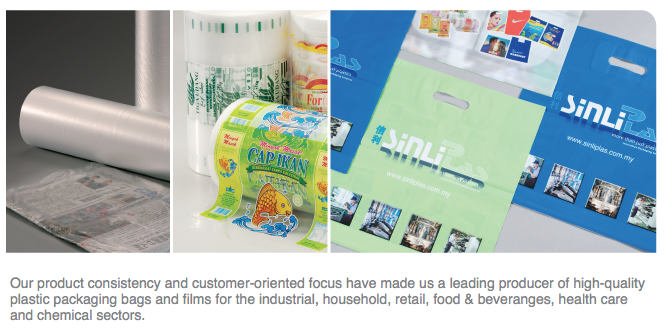
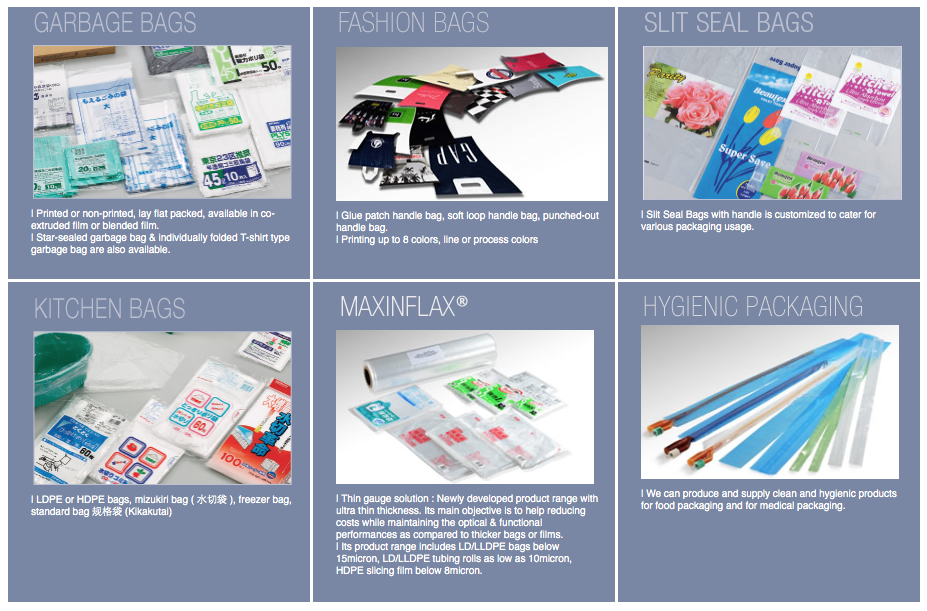
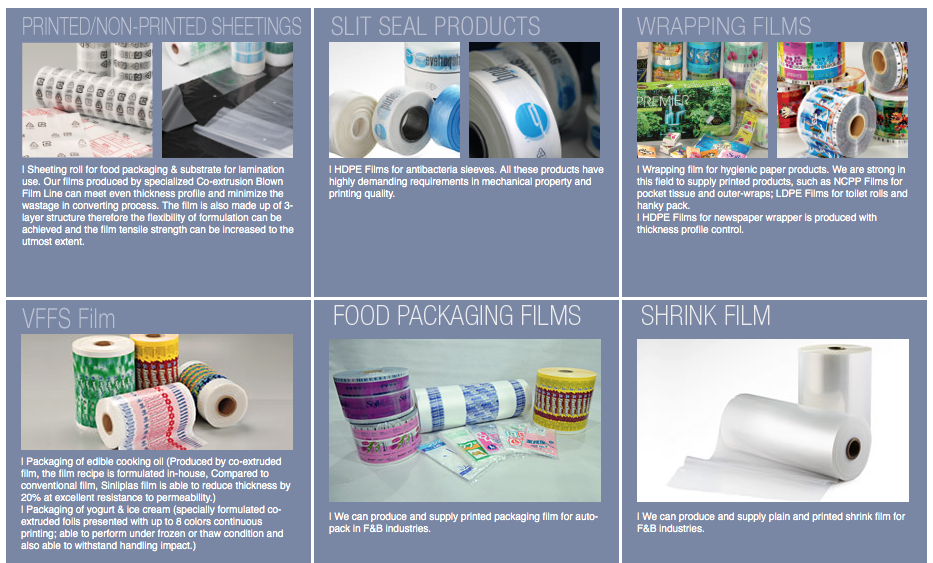
SLP Resources Berhad manufactures and sells plastic packaging and related products in Malaysia. The company offers plastic bags, including garbage, fashion, slit seal, kitchen bags, etc. It also offers polyfilms, such as printed/non-printed sheetings, wrapping films, etc.
SLP Resources Berhad also markets its products in Japan, Norway, the United Kingdom, Australia, Denmark, Germany, Indonesia, and Thailand.
The company was founded in 1989 and is headquartered in Kulim, Malaysia.
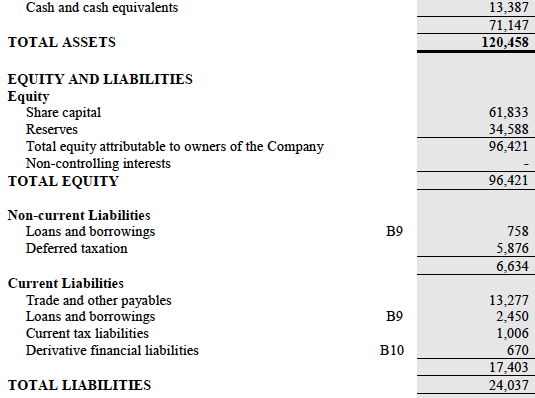
The group has strong balance sheets with net cash of approximately RM10 mil.
The group's business is quite resilient. Even during 2008 and 2009, it continues to report decent profitability.
Annual Result:
| F.Y. | Revenue ('000) | Profit Attb. to SH ('000) | EPS (Cent) | PE | DPS (Cent) | DY | NAPS | ROE (%) | |
|---|---|---|---|---|---|---|---|---|---|
| 2014-12-31 | 174,444 | 12,127 | 4.91 | 12.02 | 2.00 | 3.39 | 0.3900 | 12.59 |
|
| 2013-12-31 | 161,843 | 11,240 | 4.54 | 9.48 | 2.00 | 4.65 | 0.3610 | 12.58 |
|
| 2012-12-31 | 151,208 | 9,444 | 3.82 | 9.95 | 2.00 | 5.26 | 0.3350 | 11.40 |
|
| 2011-12-31 | 148,961 | 6,103 | 2.46 | 15.45 | 2.00 | 5.26 | 0.3170 | 7.76 |
|
| 2010-12-31 | 156,092 | 9,320 | 3.77 | 13.27 | 2.00 | 4.00 | 0.3060 | 12.32 |
|
| 2009-12-31 | 130,446 | 6,605 | 2.67 | 21.35 | 2.00 | 3.51 | 0.2930 | 9.11 |
|
| 2008-12-31 | 183,915 | 5,240 | 5.19 | 8.87 | 4.00 | 8.70 | 0.6600 | 7.86 |
|
| 2007-12-31 | 95,615 | 10,618 | 16.00 | - | - | - | 0.5800 | 27.59 |
|
Net profit experienced substantial growth in 2012. As a result, share price broke out of 40 sen range and touched > 70 sen in October 2014.
Quarter Result:
| F.Y. | Quarter | Revenue ('000) | Profit before Tax ('000) | Profit Attb. to SH ('000) | EPS (Cent) | DPS (Cent) | NAPS |
|---|---|---|---|---|---|---|---|
| 2014-12-31 | 2014-12-31 | 40,389 | 4,452 | 3,951 | 1.61 | 1.00 | 0.3900 |
| 2014-12-31 | 2014-09-30 | 44,160 | 4,069 | 3,134 | 1.27 | - | 0.3740 |
| 2014-12-31 | 2014-06-30 | 45,441 | 3,035 | 2,509 | 1.01 | 1.00 | 0.3710 |
| 2014-12-31 | 2014-03-31 | 44,454 | 3,417 | 2,533 | 1.02 | - | 0.3710 |
| 2013-12-31 | 2013-12-31 | 41,243 | 3,121 | 2,260 | 0.91 | 1.00 | - |
| 2013-12-31 | 2013-09-30 | 43,103 | 5,064 | 4,053 | 1.64 | - | 0.3520 |
| 2013-12-31 | 2013-06-30 | 39,409 | 2,982 | 2,329 | 0.94 | 1.00 | 0.3450 |
| 2013-12-31 | 2013-03-31 | 38,089 | 3,305 | 2,599 | 1.05 | - | 0.3460 |
| 2012-12-31 | 2012-12-31 | 36,406 | 2,589 | 1,645 | 0.66 | 1.00 | - |
| 2012-12-31 | 2012-09-30 | 37,923 | 2,970 | 2,196 | 0.89 | 1.00 | 0.3270 |
| 2012-12-31 | 2012-06-30 | 38,534 | 3,894 | 2,824 | 1.14 | - | 0.3280 |
| 2012-12-31 | 2012-03-31 | 38,344 | 3,229 | 2,779 | 1.12 | - | 0.3270 |
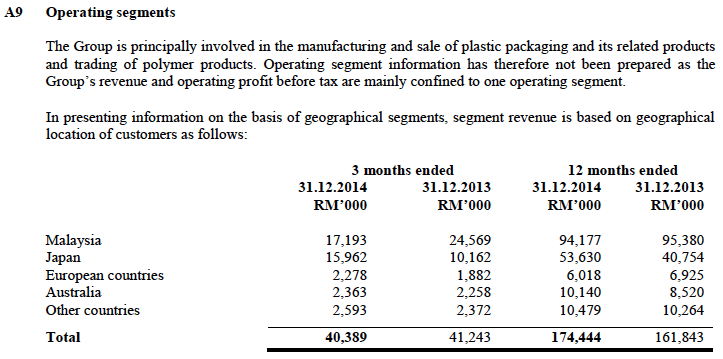
The group exports approximately 50% of its products :-
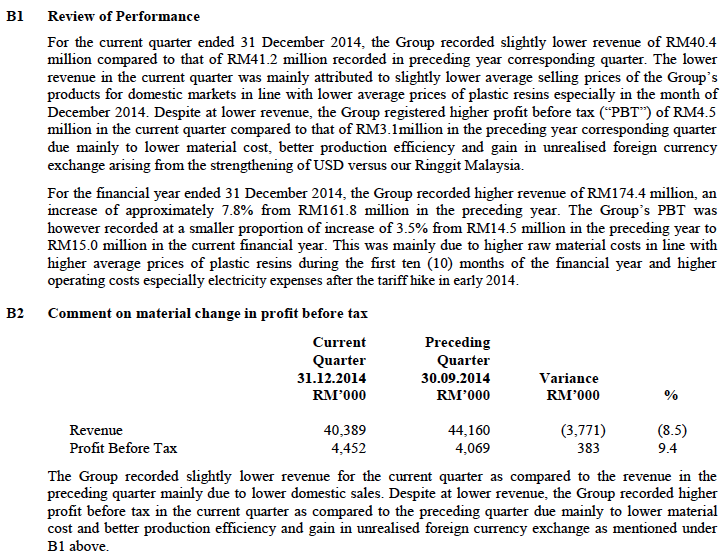
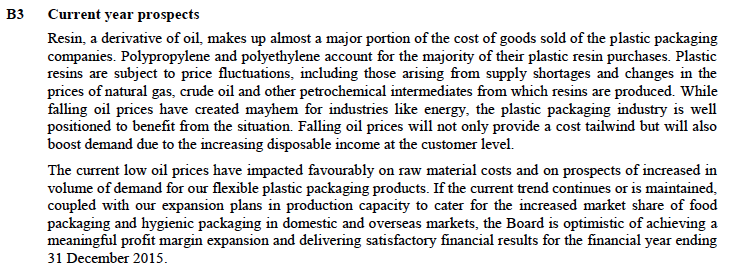
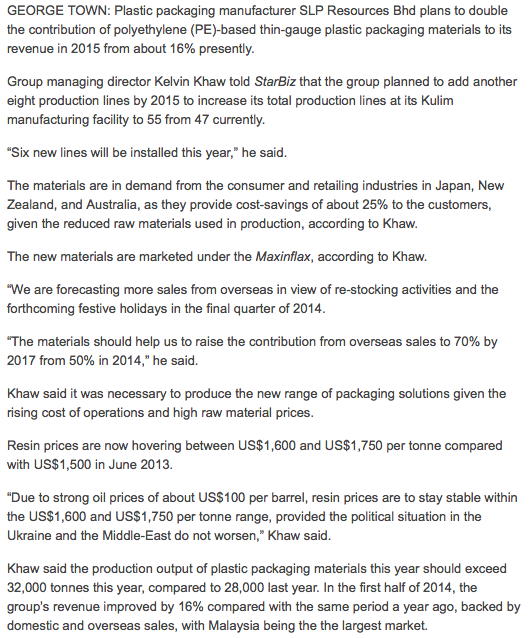
Management is quite upbeat about current year prospects :-
Please refer to Appendix 2 below for details of the group's capacity expansion.
==============================================
Appendix 1 - SLP Group


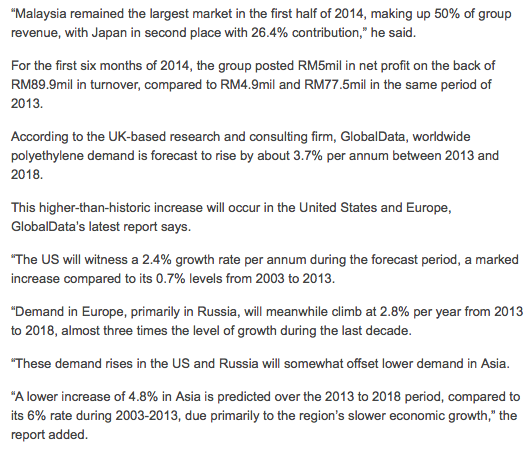
Appendix 2 - The Star Article Dated 30 September 2014
Related Stocks
| Chart | Stock Name | Last | Change | Volume |
|---|
Market Buzz
More articles on Icon8888 Gossips About Stocks
(Icon) Jaks Resources - IRR Model Shows That RM300 mil Net Profit p.a. For 30% Stake Is Plausible
Created by Icon8888 | May 01, 2020
(Icon) Notion VTec - Forget About The Virus, It Is Time To Rock and Roll
Created by Icon8888 | Mar 10, 2020
(Icon) Sam Engineering - Excellent Result. Share Price Can Potentially Double Within 2 Years
Created by Icon8888 | Mar 01, 2020
(Icon) Alliance Bank - One Off Provision Affected Previous Quarter Earning. Time To Buy On Weakness
Created by Icon8888 | Nov 13, 2019
Featured Posts


MQ Trading Signals
Time
Signal
Duration
Type
2024-04-25 09:55:00
EMA 5
5 Mins
SELL
2024-04-25 09:55:00
ADX
5 Mins
SELL
2024-04-25 09:55:00
TURTLE SYSTEM 20
5 Mins
SELL
2024-04-25 09:55:00
TURTLE SYSTEM 55
5 Mins
SELL
2024-04-25 09:50:00
ADX
10 Mins
SELL
Apps


Top Articles
1
Good Articles to Share
Malaysia in Talks With Tycoons on Casino to Revive $100 Billion Forest City
2
3
4
THE INVESTMENT APPROACH OF CALVIN TAN
5
6
BFM Podcast
7
8
BFM Podcast
#
Stock
Score
Daily Stocks
Stock Name
Last
Change
Volume
Stock Name
Last
Change
Volume
Stock Name
Last
Change
Volume
Featured Advertisers / Partners


Ride The Bull Short The Bear
CS Tan
4.9 / 5.0
This book is the result of the author's many years of experience and observation throughout his 26 years in the stockbroking industry. It was written for general public to learn to invest based on facts and not on fantasies or hearsay....