RHB Retail Research
Trading Stocks - Pecca Group
rhboskres
Publish date: Thu, 21 Mar 2019, 05:43 PM

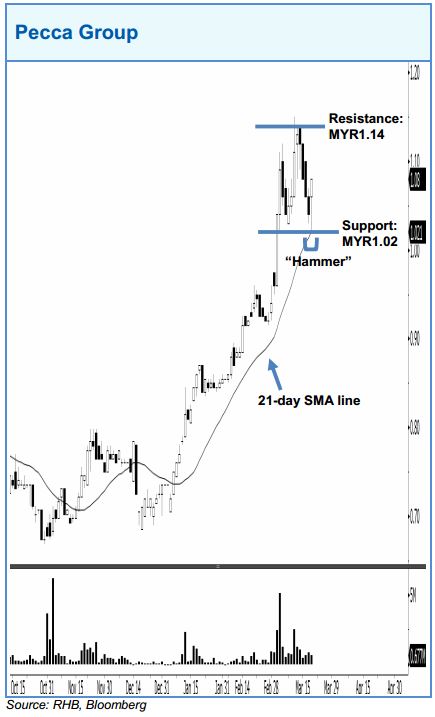
Pecca Group may rebound further after it tested the MYR1.02 support in its latest session. Given that the stock has formed a “Hammer” pattern on 20 Mar, this indicates a potential rebound. A bullish bias may appear above the MYR1.02 level, with an exit set below the MYR1.02 threshold. Towards the upside, the near-term resistance is at MYR1.14. This is followed by the MYR1.20 level.
Source: RHB Securities Research - 21 Mar 2019
Related Stocks
| Chart | Stock Name | Last | Change | Volume |
|---|
More articles on RHB Retail Research
Duopharma Biotech - Lacking Near-Term Re-Rating Catalysts; D/G NEUTRAL
Created by rhboskres | Aug 26, 2024
Discussions
Be the first to like this. Showing 0 of 0 comments


