


Round & Surge Operator Analysis
WEEKLY MARKET PREP : PLAN YOUR TRADES AHEAD [030722]

roundnsurge
Publish date: Mon, 04 Jul 2022, 06:19 PM
roundnsurge
0 59
"True trader react to the market" is the core of our Operator analysis. Operator Analysis analyze the price and volume of the big boys in equity market, where we currently using our analysis in gold market, Bitcoin and Malaysia market.
We will be sharing education material here such as to become a successful trader & investor, corporate action explanation, the financial instrument in the market you can utilize for your investment and more. We are here to help you understand the stock market.
We will be sharing education material here such as to become a successful trader & investor, corporate action explanation, the financial instrument in the market you can utilize for your investment and more. We are here to help you understand the stock market.

We will be analyzing the transaction pattern of the top active list from the last trading day’s to understand the big boys intention of the coming week's overall market trend. By knowing the transaction pattern of the overall market big boys from the last trading days, we can roughly understand what they are preparing for the coming week. Whether the market is sideways, bullish, or most big boys are going to throw their shares out in the market, we can change our trading method, strategies, or even the trading plans before it happens.
Disclaimer :
The opinions in this blog are based on the available data in the market & analyze with our own analysis on the stocks’ prices & volumes transaction pattern to understand the overall market trend. The opinions here shall not be treated as an offer, invitation or solicitation to buy or sell any securities. Round & Surge (R&S) & its associates does not warrant, represent and/or guarantee the accuracy of any opinions and information herein. R&S will not be liable for any loss or damage caused by a viewer’s reliance on information from the blog.
Last Week Stocks’ Movements
Gainers in Top Active Stocks :
Majority of the gainers in the top active stocks are showing signs of successfully attracting buyers to queue at the lower price for entry. Which means, the big boys might start to sell their shares lower in the coming weeks.
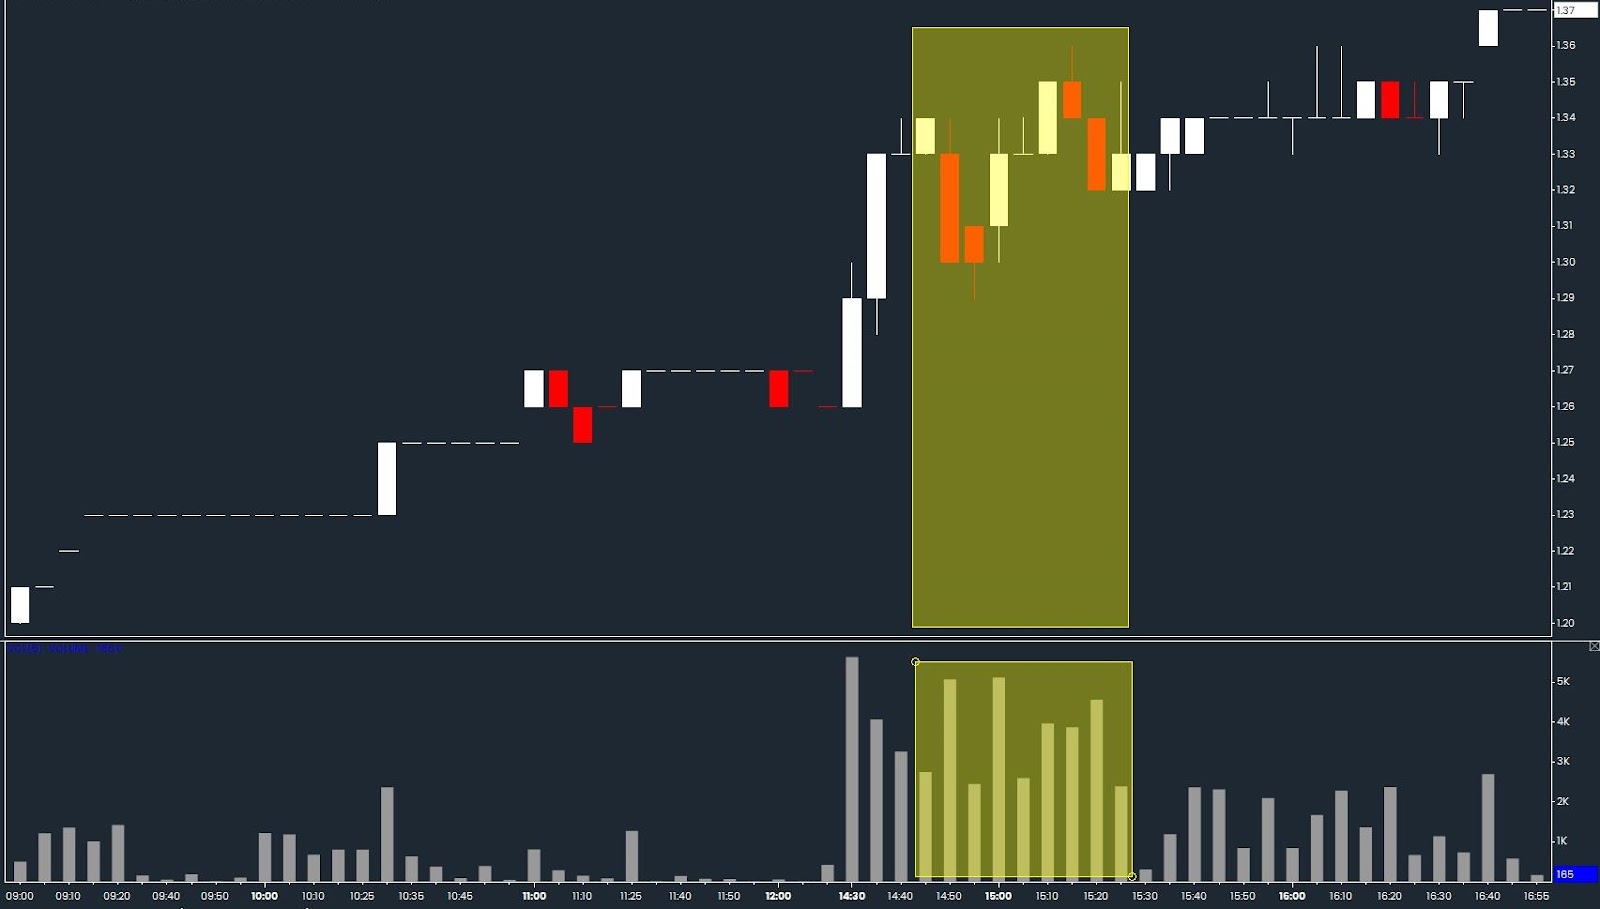
High volume sell down at high price, indicates selling to investors parking orders at low.

High Volume with limited price upwards, indicating attracting buyers with false buy up transactions.
Traders & investors shall trade with care by not being attracted into stocks that creates “Fear-Of-Missing-Out '' price markup action.
Losers in Top Active Stocks :
The stocks on the losers side are showing signs of demand coming into some stocks. Which might indicate a 1 day rebound in the coming week. However, demand flowing into the stocks doesn’t mean the trend will immediately shift to an uptrend. Therefore, it is not an indication of a market rebound yet. If any traders are familiar or know how to day trade, it will be a good chance to look for a day trade.
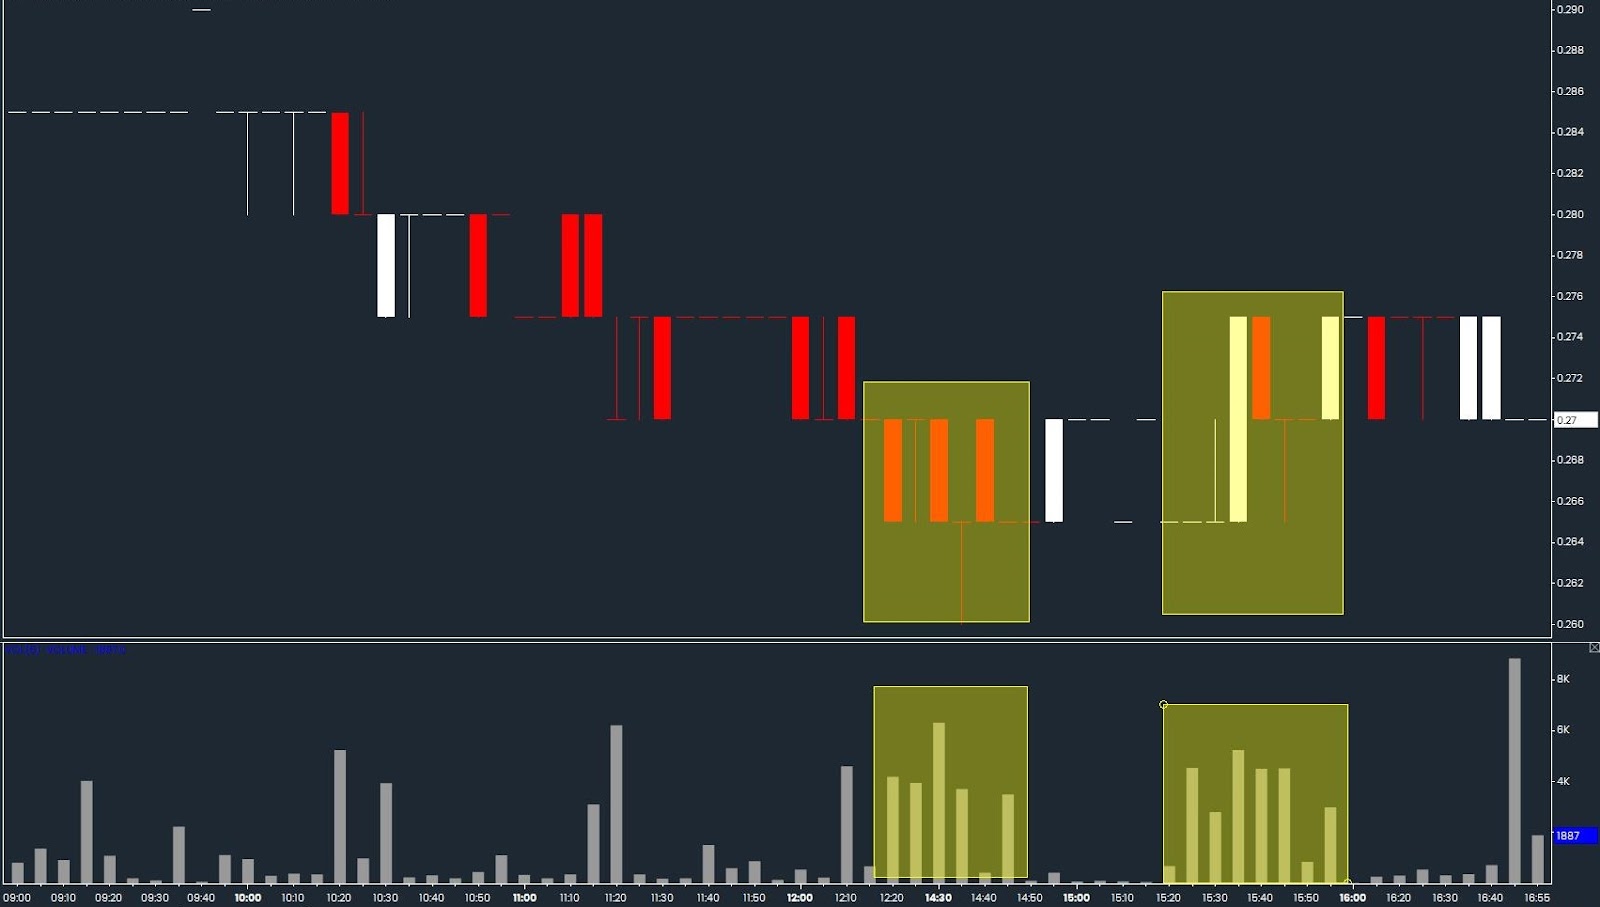
Volume up with limited price downwards, demand to support the price.
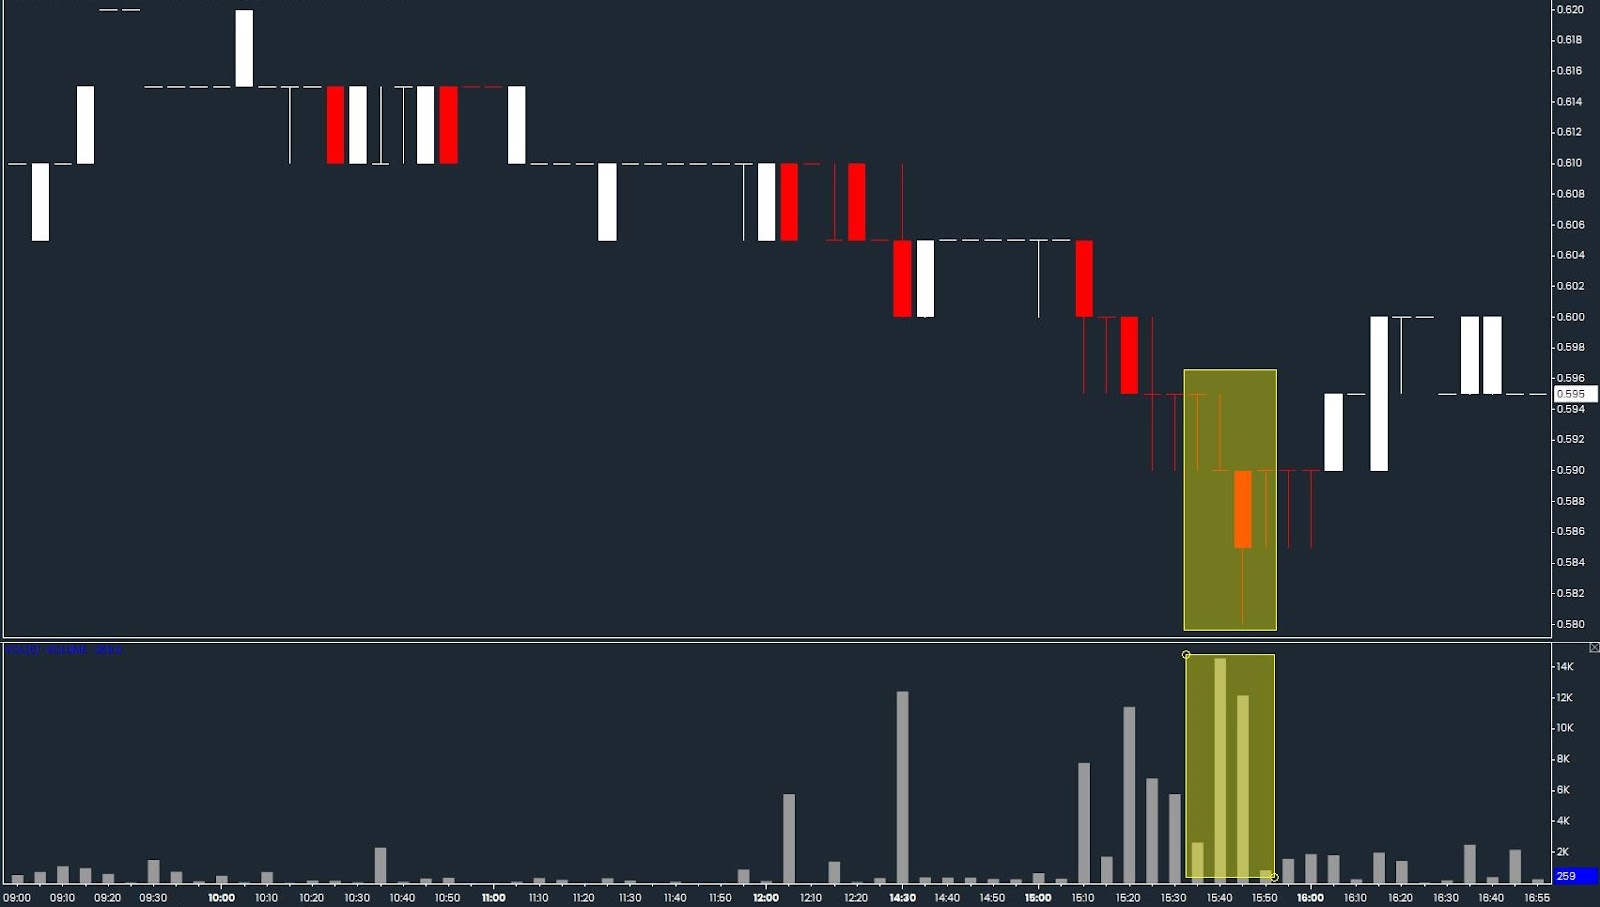
Overall Stock Price movement from last week :
Majority of the stocks are having some markup, but it is not showing signs of a rebound type of price markup. There are prices up in the market due to the selling pressure being dried out, with a small demand can easily trigger a price up. That’s why you will find stocks traded last week will have price movement of “1 day up, few days down”. This also shows us the sign of the big boys are not coming back into the market yet.
Prep for next trading week
Even though there are stocks showing bear signs, it doesn’t mean that there isn’t any trading opportunity in the market. It is what kind of trading method we are going to apply in this kind of market trend.
Usually we will apply intraday to short term trade (not more than a month) & avoid mid-term or long term entry in this kind of market. This is to reduce the risk of the market continuing to fall with more selling pressure coming in. Going short term trade can allow us to move in & out of the market with lesser overnight risk like what we have done during April.
(link about our April trade here : https://www.roundnsurge.com/news/we-sold-all-our-holdings-before-the-market-crash )
Our trading plan for next week will continue to look for stocks that show demand coming in during the low of the day for 1 day trade or intraday trade. If you know how to time the entry & exit for short term trade, you may look into this. If you don’t know how to look for this kind of stock, stay away from the market.
Learn how to trade with big boys transaction data
We are hosting a webinar on introduction of how to read big boys transaction patterns on 10th July, Sunday at 9:30am. It is a lesson trial of our Operator Analysis training course, if you wish to take up our training course & would like to find out more about our training topics. This will be a great chance for you to find out more about us.

Feel free to register the trial lesson below : https://attendee.gotowebinar.com/register/2175254437287223568
More articles on Round & Surge Operator Analysis
Understanding Support and Resistance through Big Boys Demand and Supply
Created by roundnsurge | Aug 09, 2023
"Master Support & Resistance: Trade Hang Seng with Big Player Insights. Learn to spot levels using price & volume analysis. Trade smarter, minimize risks. Watch YouTube for examples.
Maximize day trading potential returns 10%-50% a day [ Hang Seng Index : CBBC VS. STRUCTURED WARRANTS ]
Created by roundnsurge | Jun 27, 2023
Discover the differences between Callable Bull/Bear Contracts (CBBCs) and structured warrants on the Hang Seng Index (HSI) to maximize your day trading returns.
Why Traders Are Switching to CBBCs from Stocks, CFD Forex, Cryptocurrency, and Futures Contracts
Created by roundnsurge | May 22, 2023
Discover the incredible profit potential of Callable Bull/Bear Contracts (CBBC). The ability to profit in rising and falling markets, and lower entry barriers make CBBC the superior choice for trader.
The Shortcut to Success: Short-Term Trading Strategies for KLSE and SGX
Created by roundnsurge | Apr 17, 2023
Identify profitable rebound stocks by following big players' support during downtrends & retracement understanding their marking of price levels in this short-term trading strategy for KLSE & SGX.

Boost Your Income With Trading: Building for the Future vs. Living for the Now
Created by roundnsurge | Apr 05, 2023
Unlock your financial potential with investment and trading strategies for building current and future income.

From Losses to Consistent Profits: An Insider's Guide to Overcoming Trading Experience in the Stock Market
Created by roundnsurge | Feb 04, 2023
Being able to accept our losses is the first step in being able to learn from them and turn that into future profit!
KLSE Day Trading | How to read big boys transaction to make profit | R&S Training class [Cut Scene]
Created by roundnsurge | Jan 29, 2023
We're going to give you an insider's look at how the big boys get their info and make trades, so that you can do it too!

Trading Technique To Find Best Entry & Exit for 2023 Top Stocks
Created by roundnsurge | Jan 12, 2023
We can’t avoid big boys in the stock market, so we learn how they operate & take advantage of their price movement for our better entry & exit.
Discussions
Be the first to like this. Showing 0 of 0 comments
Post a Comment
Featured Posts


Apps


Top Articles
1
2
4
5
THE INVESTMENT APPROACH OF CALVIN TAN
6
7
save malaysia!
8
#
Stock
Score
Daily Stocks
Stock Name
Last
Change
Volume
Stock Name
Last
Change
Volume
Stock Name
Last
Change
Volume
MQ Trading Signals
Stock
Time
Signal
Duration
Stock
Time
Signal
Duration
Featured Advertisers / Partners


Ride The Bull Short The Bear
CS Tan
4.9 / 5.0
This book is the result of the author's many years of experience and observation throughout his 26 years in the stockbroking industry. It was written for general public to learn to invest based on facts and not on fantasies or hearsay....