Hang Seng Index Futures - Persistent Buying Momentum
sectoranalyst
Publish date: Thu, 21 Feb 2019, 11:18 AM

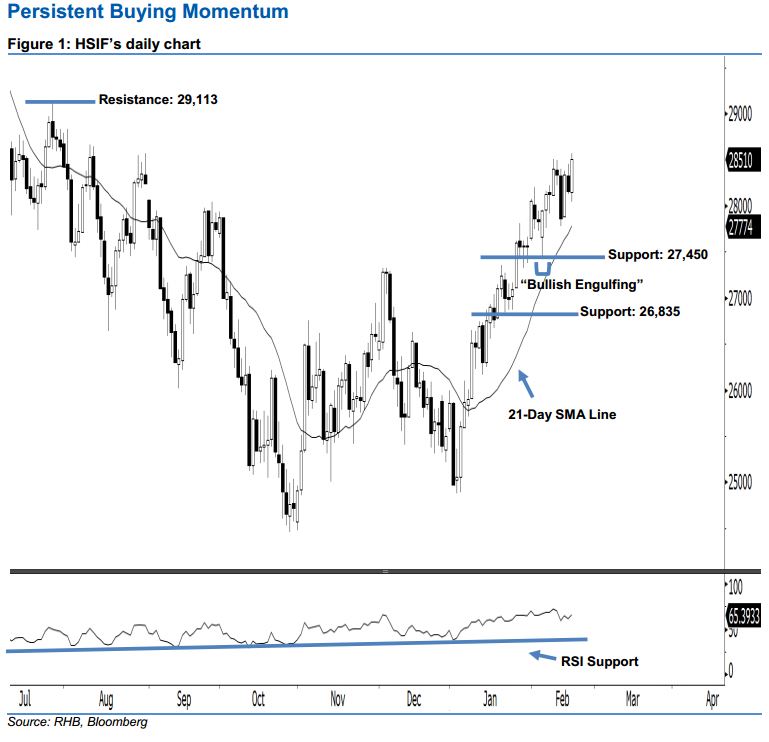
Bullish trend remains intact; stay long. The HSIF’s upside strength continued as expected after it ended higher to form a white candle yesterday. It rose to a high of 28,573 pts during the intraday session, before ending at 28,510 pts for the day. As the index has successfully recouped the previous day’s losses and hit its highest point in more than five months, this can be viewed as the buyers extending their buying momentum. Furthermore, as the 14-day RSI indicator is now rising higher without being overbought, this has enhanced the bullish sentiment.
According to the daily chart, we anticipate the immediate support level at 27,450 pts, obtained from the low of 8 Feb’s “Bullish Engulfing” pattern. If this level is taken out, look to 26,835 pts – ie the low of 22 Jan – as the next support. On the other hand, we are now eyeing the immediate resistance level at 29,113 pts, situated at the previous high of 26 Jul 2018. Meanwhile, the next resistance is seen at the 30,000-pt psychological spot.
Therefore, we advise traders to maintain long positions, since we had originally recommended initiating long above the 26,000-pt level on 10 Jan. At the same time, a trailing-stop can be set below the 27,450-pt threshold in order to secure part of the gains.
Source: TA Research - 21 Feb 2019
More articles on TA Sector Research
Created by sectoranalyst | Nov 22, 2024
Created by sectoranalyst | Nov 21, 2024
Created by sectoranalyst | Nov 21, 2024
Created by sectoranalyst | Nov 21, 2024


