INARI: Golden Cross
teknikal
Publish date: Tue, 18 Jun 2024, 11:28 AM
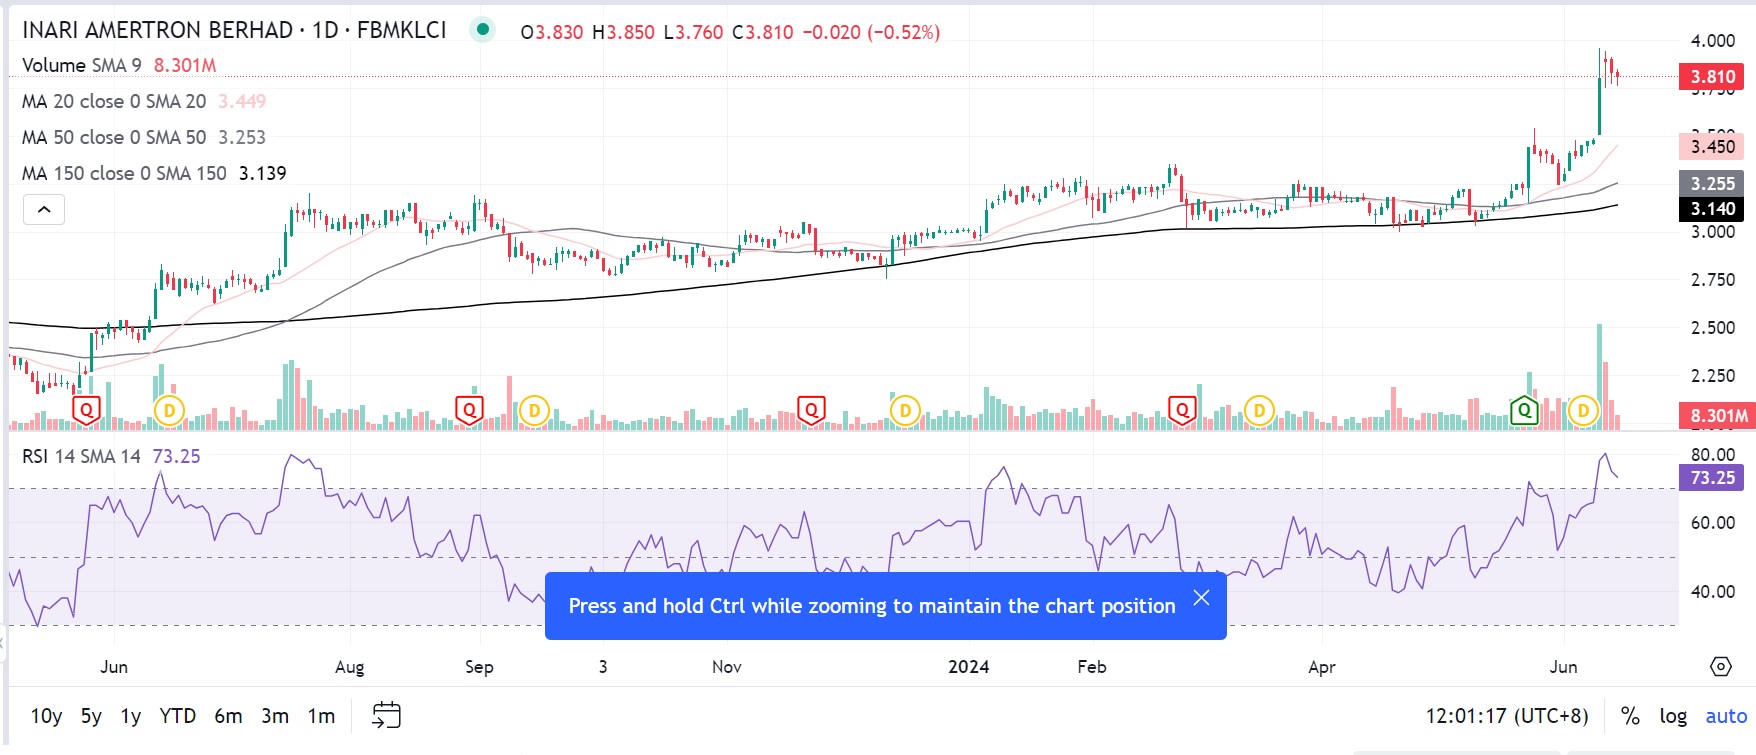
Trend Analysis: Uptrend
The stock has been in an overall uptrend since the beginning of 2024, as indicated by higher highs and higher lows.
The recent sharp upward spike in price is indicative of a strong breakout.

Source: KLSE Screener / Trading View
Moving Averages: Bullish
20-day MA: The stock is above the 20-day MA, indicating recent positive momentum.
50-day MA: The stock price is currently well above the 50-day moving average, which is a bullish sign. It suggests short-term upward momentum.
150-day MA: The price is also above the 150-day MA, reinforcing the long-term upward trend.
200-day MA: The stock price is significantly above the 200-day MA, indicating long-term bullish sentiment.
Volume Analysis
The volume bars at the bottom show a significant increase in trading volume during the recent price spike. This suggests strong buying interest and validates the upward move.
Technical Indicators: Golden Cross
The 50-day MA has crossed above the 150-day and 200-day MAs, which is known as a "Golden Cross" and typically a bullish signal.
The 20-day MA also recently crossed above 50-day MA.
Price Levels:
The stock price recently surged to 3.83, a significant increase from previous levels.
Key support levels based on moving averages are at approximately 3.42 (50-day MA), 3.24 (20-day MA), and 3.13 (150-day MA).
Conclusion:
INARI is showing strong bullish momentum with significant price action above key moving averages and a substantial increase in volume. The recent breakout above previous resistance levels indicates a continuation of the upward trend. However, given the sharp rise, there could be potential for short-term pullbacks. Long-term investors might consider buying on dips near support levels, while short-term traders should watch for continued volume and price action confirmation.


