


UOB Kay Hian Research Articles
Traders' Corner - Tomypak Holdings (TOMY MK)

UOBKayHian
Publish date: Thu, 27 Jul 2017, 12:09 PM
UOBKayHian
0 1,987
An official blog in I3investor to publish research reports provided by UOB Kay Hian research team.
All materials published here are prepared by UOB Kay Hian. For latest offers on UOB Kay Hian trading products and news, please refer to: http://www.utrade.com.my
UOB Kay Hian Securities (M) Sdn Bhd (194990-K)
Hotline:
1800 UTRADE /
1800 88 7233 (Securities)
+6088 235611 (Futures)
Email: contact@utrade.com.my
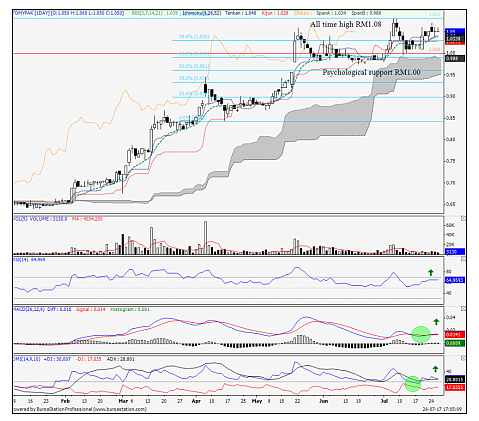
- Technical BUY on breakout with +12.8% potential return
- Last price: RM1.05
- Target price: RM1.17, RM1.23
- Support: RM1.00
- Stop-loss: RM0.995
BUY on breakout with a target price of RM1.23 and stop-loss at RM0.995. Based on the daily Ichimoku chart, the stock is making higher highs and higher lows, key characteristics of an uptrend pattern. A buying signal is seen as the stock is trading above the cloud while the Heat Wave indicators - Tenkan-sen line, Kinjun-sen line and the Chikao span line - are showing bullish signals. The bullish signal is also supported by the MACD and the ADX showing the start of an uptrend. We expect TOMY will continue the bullish movement once it manages to penetrate above the alltime high of RM1.08.
Expected Timeframe: 2 weeks to 2 months.
Source: UOB Kay Hian Research - 27 Jul 2017
Related Stocks
| Chart | Stock Name | Last | Change | Volume |
|---|
Market Buzz
More articles on UOB Kay Hian Research Articles
IHH Healthcare - 2Q22 Blip as Admissions See An Unequal Recovery
Created by UOBKayHian | Aug 26, 2022
IHH Healthcare - 4Q21 Results Beat Expectations Off Sustained Key Contributions
Created by UOBKayHian | Feb 24, 2022
Top Glove - 1QFY22 Results Weighed by Softened Industry Prospects
Created by UOBKayHian | Dec 13, 2021
Gloves Companies – Malaysia - Glove Manufacturers Deemed Non-Essential Under EMCO
Created by UOBKayHian | Jul 12, 2021
Rubber Gloves – Malaysia - New Coronavirus Sparks Loftier But Justified Valuations
Created by UOBKayHian | Jan 29, 2020
Featured Posts


Apps


Top Articles
1
3
Good Articles to Share
4
save malaysia!
5
Good Articles to Share
6
Good Articles to Share
Scuffles as Israelis demand deal for Gaza hostages | REUTERS
7
BFM Podcast
8
BFM Podcast
#
Stock
Score
Daily Stocks
Stock Name
Last
Change
Volume
Stock Name
Last
Change
Volume
Stock Name
Last
Change
Volume
Featured Advertisers / Partners


Ride The Bull Short The Bear
CS Tan
4.9 / 5.0
This book is the result of the author's many years of experience and observation throughout his 26 years in the stockbroking industry. It was written for general public to learn to invest based on facts and not on fantasies or hearsay....