Technical Analysis - KAWAN FOOD BHD
kltrader
Publish date: Wed, 16 Nov 2022, 05:55 PM

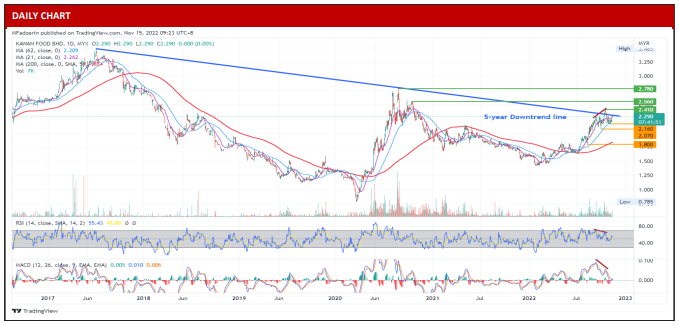
On the daily chart, KAWAN FOOD Berhad (KAWAN) has rallied since February 2022, hence the price has been moving above its 200, 62 and 21-day moving averages that indicates the mid-term uptrend is intact. Despite its bullish trajectory, the price failed to break and stay above its key 5-year long-term downtrend line. This might trigger a potential of reversal signal moving forward. Furthermore, a bearish divergence signal has emerged between the price and both indicators RSI and MACD which we believe the price could be on the verge of a pullback. The impending decline might be confirmed if the share price slides below the nearby support level of 2.16. Alternatively, if the price breaks and remains above its key downtrend line, we expect the price to resume the bullish momentum to retest its immediate resistance of 2.41. Our research house has a BUY call on KAWAN and a TP of RM 2.36.
Source: BIMB Securities Research - 16 Nov 2022
Related Stocks
| Chart | Stock Name | Last | Change | Volume |
|---|
Market Buzz
More articles on Bimb Research Highlights
Created by kltrader | Nov 11, 2024
Created by kltrader | Nov 11, 2024
Created by kltrader | Nov 11, 2024
Created by kltrader | Nov 08, 2024


