MQ Trader – Volume Screener
MQTrader Jesse
Publish date: Fri, 10 Aug 2018, 11:53 PM
Introduction
In this blog, we will be explaining on how to use MQ Trader Volume Screener which is introduced in our last post – MQ Trader – Indicators of Volume Screener. This blog will cover the demonstration of using the MQ Trader Volume Screener to filter stocks with high trading volume.
To read the introduction of MQ Trader Stock Screener, please visit MQ Trader - How to pick a stock?
Simple yet powerful
MQ Trader Volume screener is the simplest screener to be understood as compared to MQ Trader Technical Screener and Fundamental Screener, as it does not require exotic mathematical formulas by involving only one type of indicator which is Volume Moving Average (VMA).
Volume does not provide trading signals directly to traders but it is a very important indicator which can be seen on every single technical chart. It is widely utilized by investors for decades because it is able to help traders on confirming a market turnaround or trend reversal by determining whether the price movement is proportional to the volume momentum.
A stock with good rating in its technical analysis is not always the best stock for us to enter our position if it does not possess strong volume. Meanwhile, a high trading volume does not contribute to the emergence of a bullish trend all the time but it can lead a bearish trend sometimes.
In this article, we will be explaining on how to combine volume and technical screener to identify bullish stocks with high trading volume.
Technical Screener for bullish stocks
In our previous post, we shared some examples on how to look for up-trending / bullish stocks from MQ Trader Technical Screener. Please visit MQ Trader – Technical Screener for Up-trending Stocks for more information.
Table 1: Technical filters’ setting for bullish stocks
|
Technical indicators |
|
|
Bollinger Band |
Price above Bollinger Band |
|
ADX Filter |
+DMI above –DMI & ADX above 25 (Strong Trend) |
|
OBV |
Above by 50% |
|
EMA |
|
|
5-day EMA |
EMA 5 above EMA 20 |
Volume Screener for stocks with high trading volume
Shorter-term investors always look for opportunities within a short period, so VMA of lesser days will serve as shorter-term investors’ main indicators to determine the trading volume of a stock. The criteria below is used to screen for bullish stocks with high trading volume for short term investment based on MQ Trader trading strategies:
- 10-day Average Volume (VMA 10): VMA 10 above VMA 20
Then, a list of stocks that match these criteria appears within a few seconds on 10 August 2018 as shown as below:

Source: MQ Trader Stock Analysis System
Next, we will be picking one of the stocks - KRETAM for demonstration purpose.
Screening Technical Chart
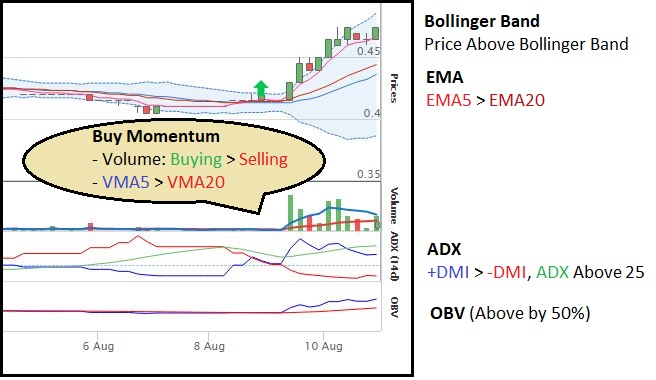
Figure below shows that KRETAM is currently experiencing high trading volume which exceeds 7 million in a day. This shows that it is actively traded in the stock market at the moment.
![]()
Source: MQ Trader Stock Analysis System

Figure 1: EMA 5 Crossover Hourly Chart of KRETAM
Figure 1 shows that KRETAM meets all the requirements that we set indicating that it is undergoing bullish as well as having high trading volume. The continuous high buying volume indicates that the share price will be ongoing the bullish trend on the following day. Besides, there is buy signal observed on 9 August 2018 showing that the share price will continue to rise in the near term. Hence, it is a good opportunity which we can enter and hold this counter before sell signal or any sign of trend reversal take place.
Conclusion
As compared to the stocks that are filtered in MQ Trader – Technical Screener for Up-trending stocks, coupling technical screener with volume screener can effectively eliminate pennies stocks which their share price can be easily manipulated by traders. By trading stocks that are actively traded, liquidity of a stock can be enhanced to prevent us from trapping our capitals in the stocks with low trading volume.
Longer-term investors who put high priority on fundamental analysis, can refer to MQ Trader – Fundamental Screener to learn how to use MQ Trader fundamental screener. Screening stocks by combining all these three screeners (Technical, Fundamental and Volume) can also be done by using MQ Trader Combined Screener.
Community Feedback
We encourage traders to try out and evaluate the MQ Trader system and provide us feedback on the features you like to see in the system. We have received many positive feedbacks so far, and we are currently compiling and reviewing them for possible inclusion into the next release of the system.
We would like to develop this system based on community feedback to cater for community needs. Thanks to all those who have provided valuable feedback to us. Keep those feedbacks coming in!
Disclaimer
This article does not represent a BUY or SELL recommendation on the stock covered. Traders and Investors are encouraged to do their own analysis on stocks instead of blindly following any Trading calls raised by various parties in the Internet. We may or may not hold position in the stock covered, or initiate new position in the stock within the next 7 days.
Join us now!
MQ Trader stock analysis system uses Artificial Intelligence (AI), various technical indicators and quantitative data to generate accurate trading signals without the interference of human's emotions and bias against any particular stock. It comprises trading strategies which are very popular among fund managers for analysing stocks.
MQ Trader stock analysis system is SPONSORED for MQ Trader members. To use this amazing tool, you can sign up via MQ Trader Sign Up!
Contact us
Please do not hesitate to contact us if you have any enquiry:
Related Stocks
| Chart | Stock Name | Last | Change | Volume |
|---|
Market Buzz
More articles on MQTrader Education Series

Created by MQTrader Jesse | Apr 13, 2023
Created by MQTrader Jesse | Aug 06, 2021
Created by MQTrader Jesse | Nov 01, 2019


