


MQTrader Education Series
MQ Trader – Fundamental Indicators [TOPGLOV] (Part 1)

MQTrader Jesse
Publish date: Wed, 22 Aug 2018, 02:51 PM
Introduction
Financial statements are the main source of information to perform fundamental analysis. Hence, it is important to know how to extract and interpret the financial data. There are a number of fundamental indicators which are widely used by investors, as they represent a company’s performance and valuation by using the financial data. Similar to technical analysis, fundamental analysis has to be performed by using multiple fundamental indicators to draw a clearer image of company’s financial background.
For understanding more about MQ Trader Fundamental Analysis, please read MQ Trader – Fundamental Analysis [TOPGLOV].
MQ Trader Fundamental Chart
MQ Trader Fundamental Chart is a very versatile tool which enables users to access into the charts plotted in various modes in a single page:
- Different fundamental indicators (i.e. Revenue, Profit, EPS, PE, DPS, DY, NAPS, ROE)
- Different period (I.e. Quarter, Annual)
- Different chart designs (I.e. Line, Bar)
To view MQ Trader Fundamental Chart, you can click onto "View Financial" from MQ Fundamental Rating page as shown in the figure below.
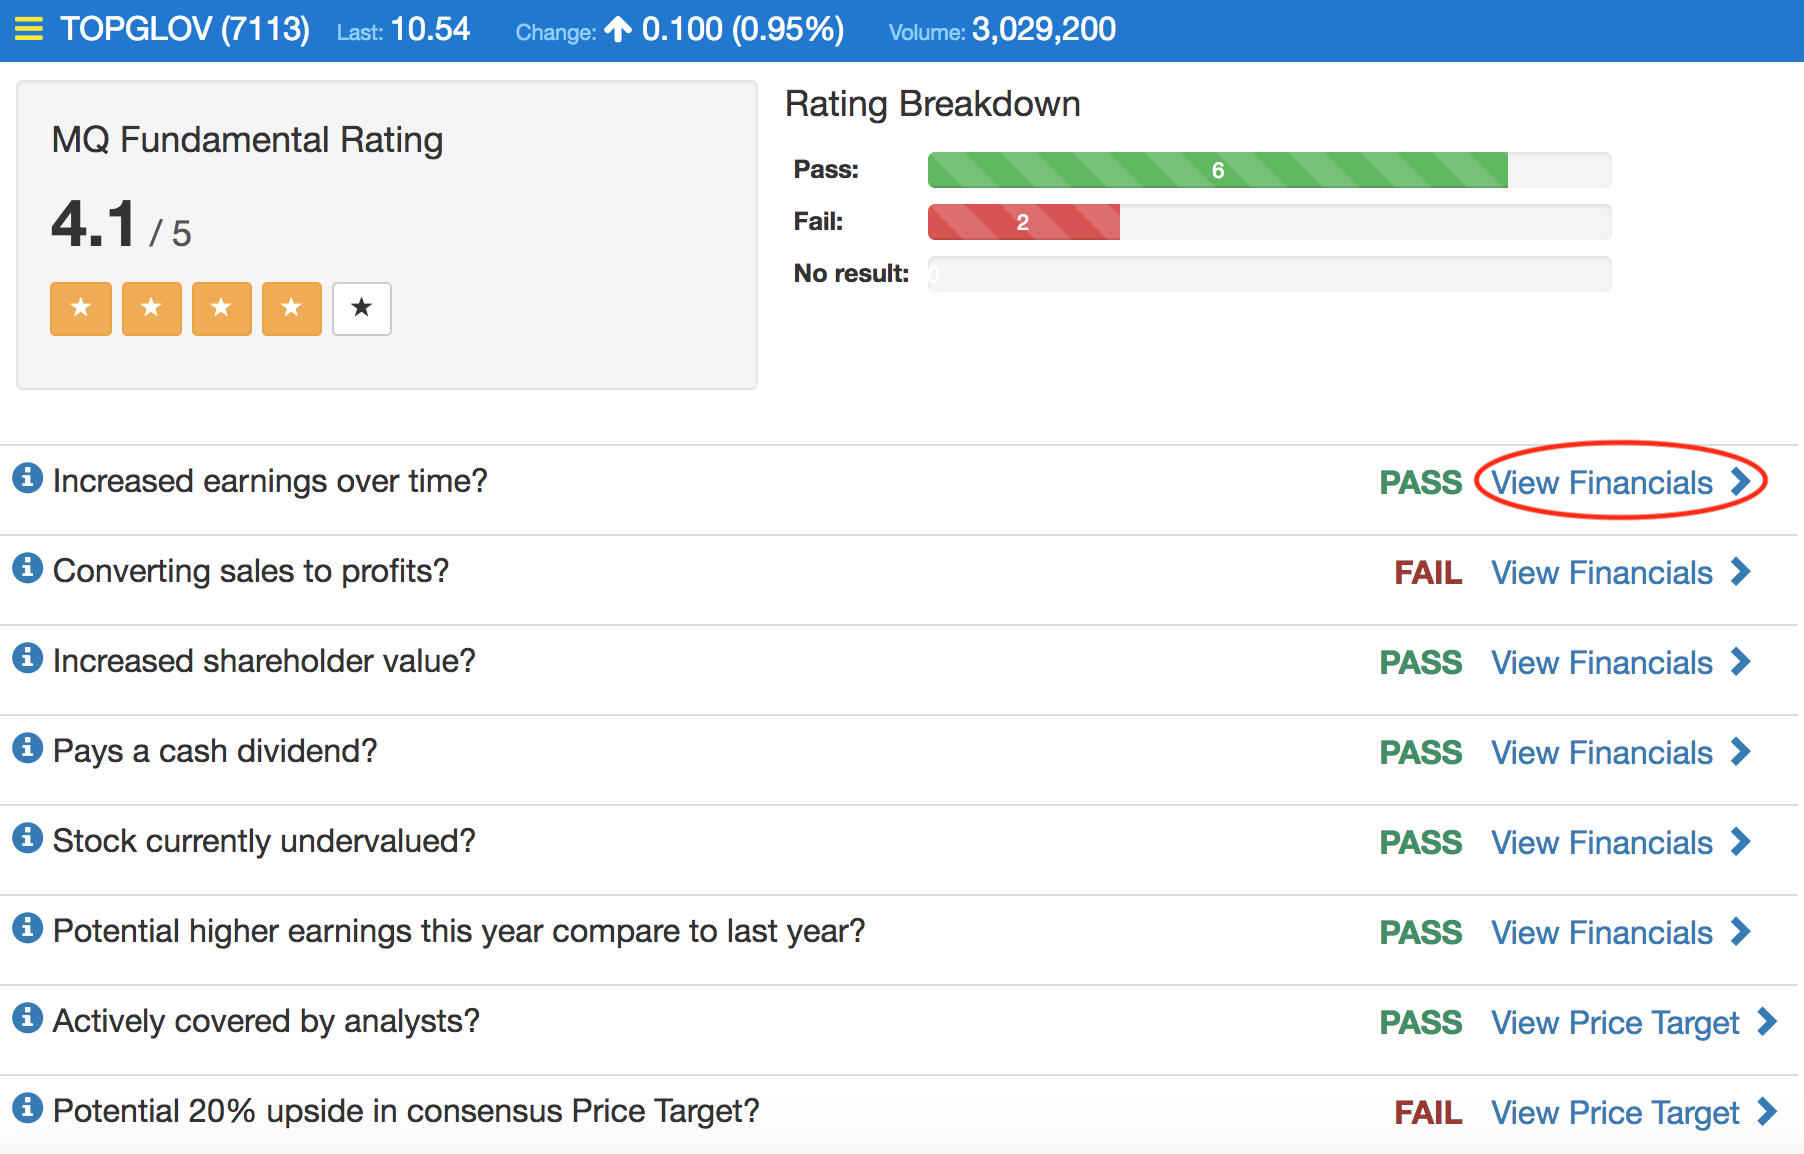
Figure 1: MQ Fundamental Rating of TOPGLOV
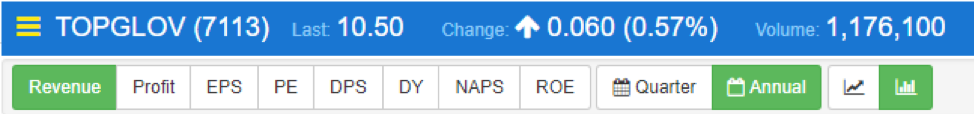
Figure 2: Features on Fundamental Chart
Figure above shows the features that are available on MQ Trader Fundamental Chart. You can simply click on any fundamental indicators to view the charts accordingly. Besides, both annually and quarterly charts are switchable to each other to have a clearer image of the company’s growth. Line or bar charts are also provided to meet the preference of all users.
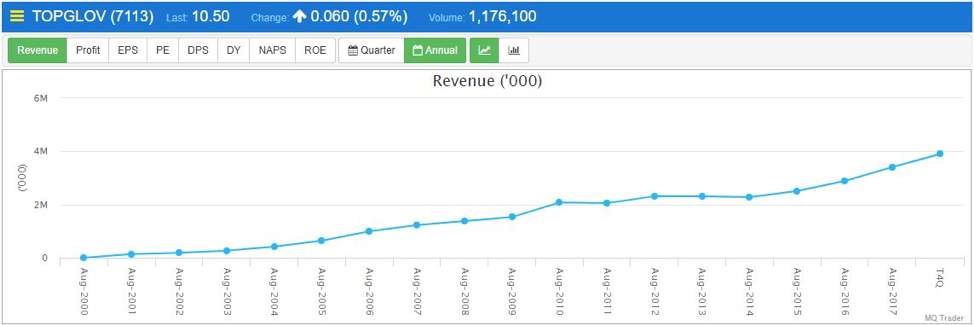
Figure 3: Annual revenue line chart of TOPGLOV

Figure 4: Annual revenue bar chart of TOPGLOV
The examples of the annual and quarter charts with different fundamental indicators will be demonstrated later in this post.
Fundamental indicators in MQ Trader system
MQ Trader has selected the 8 most relevant fundamental indicators which are useful in portraying the stocks’ performance in Malaysia’s stock market. First of all, we would like to introduce the 2 simplest fundamental indicators in this article:
- Revenue
Revenue is the amount of money that a company actually receives from its business activities during a specific time frame. Normally, you can find revenue as the top line or gross income figure where costs are deducted to obtain net income. It is also known as sales on the income statement.
Calculation of revenue:
Price of goods or services sold / the number of units sold
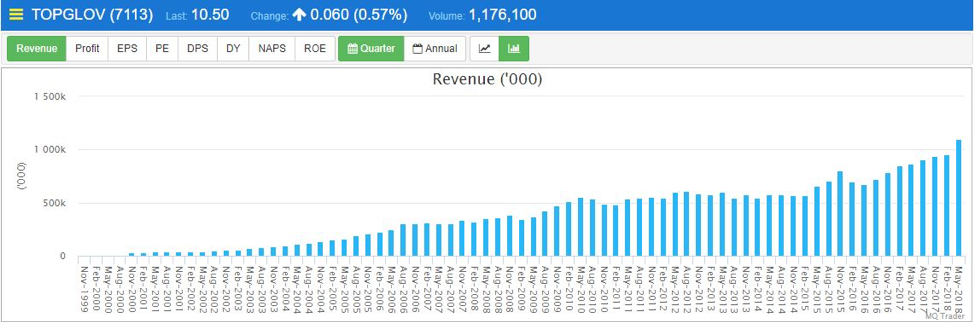
Figure 5: Quarter revenue of TOPGLOV.
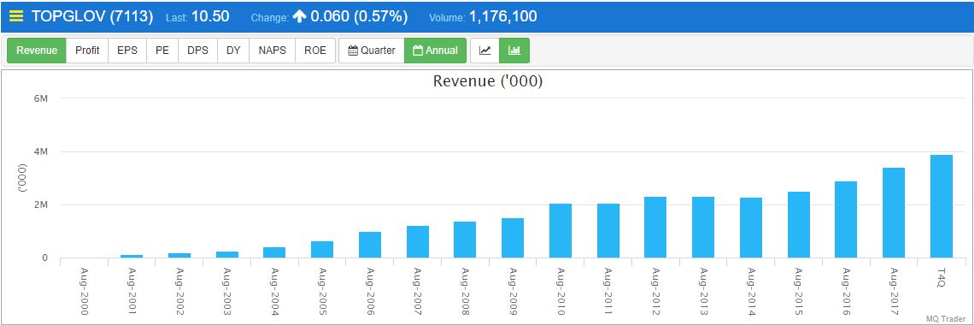
Figure 6: Annual revenue of TOPGLOV.
Figure 5 and 6 show that the revenue of TOPGLOV is increasing over the years indicating that the sales of its products are improving in the long run.
To see the details, please proceed to TOPGLOV's Annual Revenue Chart.
2. Profit
Profit is a financial benefit that can be realized when there is a surplus obtained after the deduction of the expenses, costs and taxes from the amount of revenue gained from a business activity.
Calculation of profit:
Total revenue – Total expenses
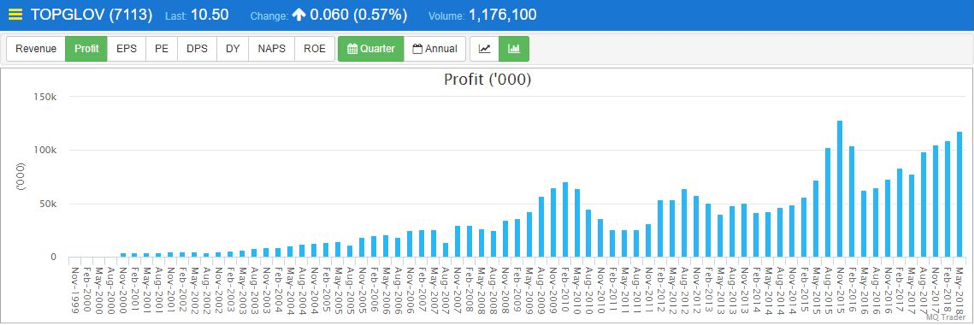
Figure 7: Quarter profit of TOPGLOV
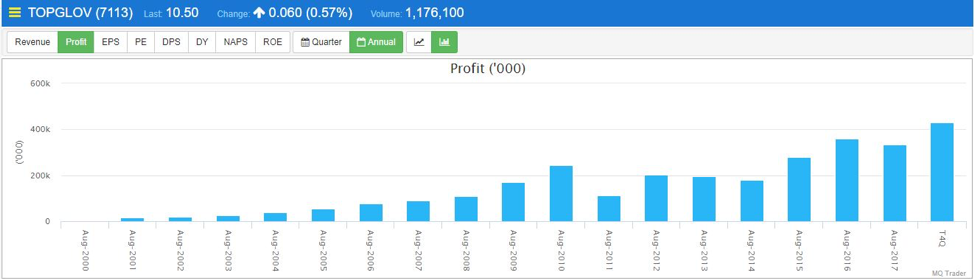
Figure 8: Annual profit of TOPGLOV
Figure 7 and 8 show that the profit of TOPGLOV is increasing over the years indicating that its profit increases proportionally with its revenue.
To see the details, please view TOPGLOV's Annual Profit Chart.
What are financial ratios?
Other than revenue and profit of a company, the rest of the financial indicators (6 of them) are financial ratios which also play important roles in measuring the performance of a company. To know more about financial ratios, kindly read MQ Trader – Fundamental Indicators [TOPGLOV] Part 2.
Community Feedback
We encourage traders to try out and evaluate the MQ Trader system and provide us feedback on the features you like to see in the system. We have received many positive feedbacks so far, and we are currently compiling and reviewing them for possible inclusion into the next release of the system.
We would like to develop this system based on community feedback to cater for community needs. Thanks to all those who have provided valuable feedback to us. Keep those feedbacks coming in!
Disclaimer
This article does not represent a BUY or SELL recommendation on the stock covered. Traders and Investors are encouraged to do their own analysis on stocks instead of blindly following any Trading calls raised by various parties in the Internet. We may or may not hold position in the stock covered, or initiate new position in the stock within the next 7 days.
Join us now!
MQ Trader stock analysis system uses Artificial Intelligence (AI), various technical indicators and quantitative data to generate accurate trading signals without the interference of human's emotions and bias against any particular stock. It comprises trading strategies which are very popular among fund managers for analysing stocks.
MQ Trader stock analysis system is SPONSORED for MQ Trader members. To use this amazing tool, you can sign up via MQ Trader Sign Up!
Contact us
Please do not hesitate to contact us if you have any enquiry:
Email: service@mqtrader.com
Related Stocks
| Chart | Stock Name | Last | Change | Volume |
|---|
More articles on MQTrader Education Series
Is there a safe haven to invest in a recessionary environment?
Created by MQTrader Jesse | Apr 13, 2023
MQ Trader - Why trade in a stock market that has strong currency?
Created by MQTrader Jesse | Aug 06, 2021
MQ Trader - How to validate buy signals by using MQ Live Backtesting? [ECOWLD]
Created by MQTrader Jesse | Nov 01, 2019
Discussions
Be the first to like this. Showing 0 of 0 comments
Post a Comment
Featured Posts
Introducing MY's First IPO Fund for Sophisticated Investors!
New Update. Discover investment communities that resonate with your ideas
M & A Value Partners IPO Equity Fund has been launched - Targeted 13% Return p.a
Latest Videos


Apps


Top Articles
1
2
3
BFM Podcast
4
Mercury Securities Research
5
BFM Podcast
6
BFM Podcast
8
#
Stock
Score
Daily Stocks
Stock Name
Last
Change
Volume
Stock Name
Last
Change
Volume
Stock Name
Last
Change
Volume
Featured Advertisers / Partners


Ride The Bull Short The Bear
CS Tan
4.9 / 5.0
This book is the result of the author's many years of experience and observation throughout his 26 years in the stockbroking industry. It was written for general public to learn to invest based on facts and not on fantasies or hearsay....