


MQTrader Education Series
MQ Trader – Fundamental Indicators [TOPGLOV] (Part 2)

MQTrader Jesse
Publish date: Thu, 23 Aug 2018, 05:43 PM
Introduction
In this blog post, we will be explaining the financial ratios used in MQ Trader Fundamental Analysis. This post is the continuation of the previous post related to the first 2 fundamental indicators. For better understanding, kindly read MQ Trader- Fundamental Indicators [TOPGLOV] (Part 1).
Financial ratios
- Earnings Per Share (EPS)
Earnings per share (EPS) are the portion of a company's profit allocated to each outstanding share of common stock. Earnings per share serve as an indicator of a company's profitability.
Calculation of EPS
EPS = (Net Income - Dividends on Preferred Stock) / Average Outstanding Shares
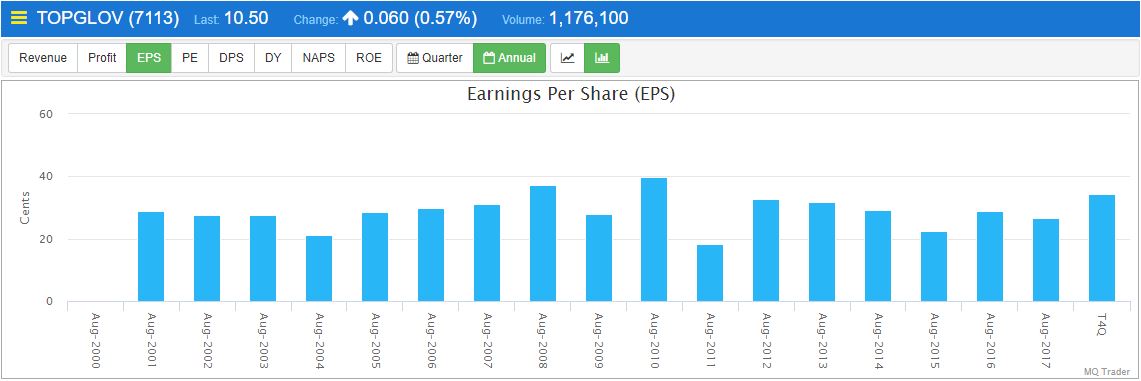
Figure 1: Annual EPS of TOPGLOV
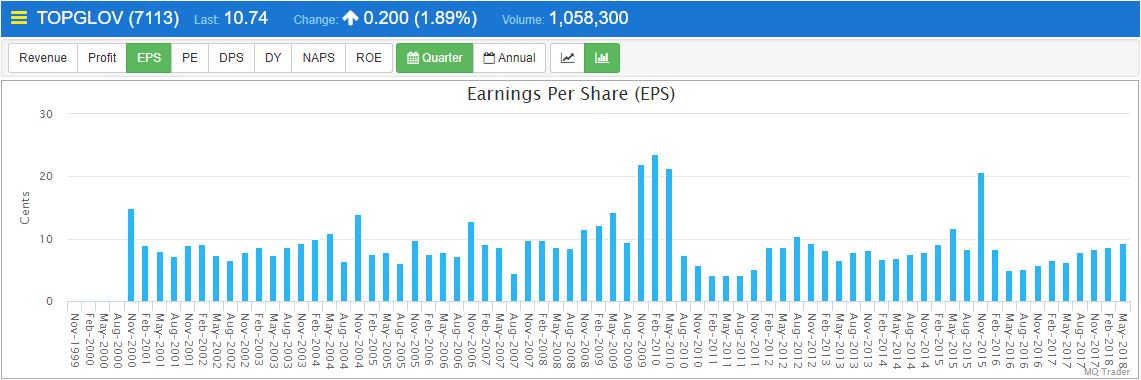
Figure 2: Quarter EPS of TOPGLOV
Figure 1 and 2 show that TOPGLOV’s EPS is increasing over the past 4 years. It is anticipated that its EPS will rise in this year, as EPS in T4Q is higher than last year’s.
To see the details, please proceed to Annual EPS Chart of TOPGLOV.
- Price Earnings Ratio (PE)
The price-earnings ratio (P/E ratio) is the ratio for valuing a company that measures its current share price relative to its per-share earnings. The value of this indicator can determine whether the stock is currently undervalued.
The calculation for PE ratio:
Market Value per Share / Earnings per Share
Anything with a P/E over 15 looks unattractive based on price. The only exception that we allow to our P/E rule is for growth stocks with consistent records of rising earnings. If a company's earnings are advancing faster than the market average, it can command a higher-than-average price/earnings ratio.
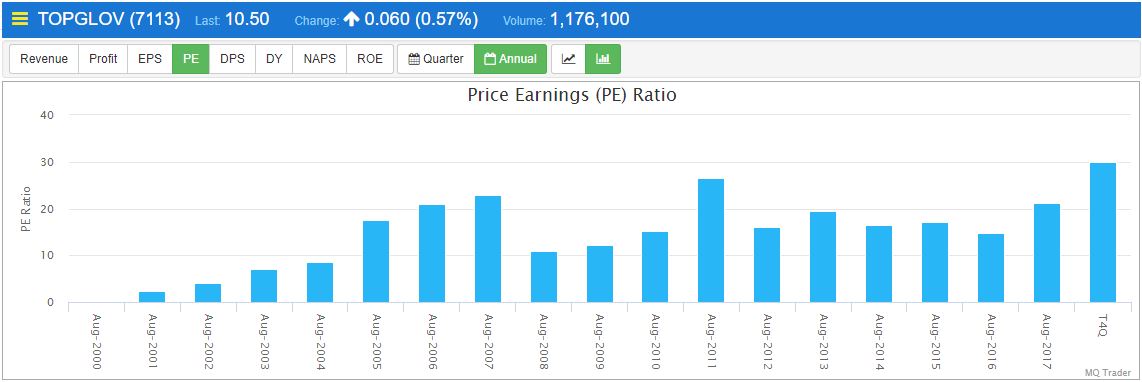
Figure 3: Annual PE ratio of TOPGLOV
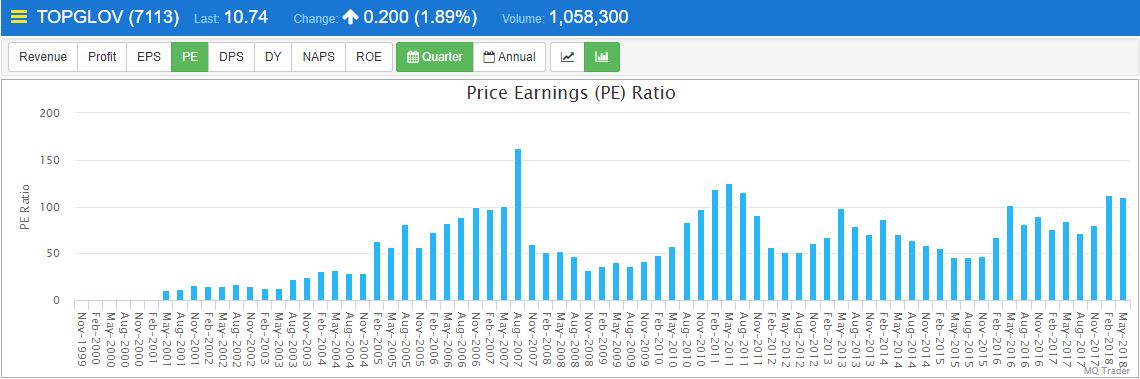
Figure 4: Quarter PE ratio of TOPGLOV
According to the statement above, TOPGLOV has consistent records of rising earnings, so it is considered to pass this criteria despite its PE ratio exceeds 15.
To view the data and the charts, kindly visit Annual PE chart of TOPGLOV for information.
1. Dividend Per Share (DPS)
Dividend per share (DPS) is the sum of declared dividends issued by a company for every ordinary share outstanding. DPS gauges how profitable a company is over a specific period of time.
Calculation of DPS:
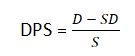
Where
- D: Sum of dividends over a period (usually a quarter or a year)
- SD: Special, one-time dividends in the period
- S: Ordinary shares outstanding for the period
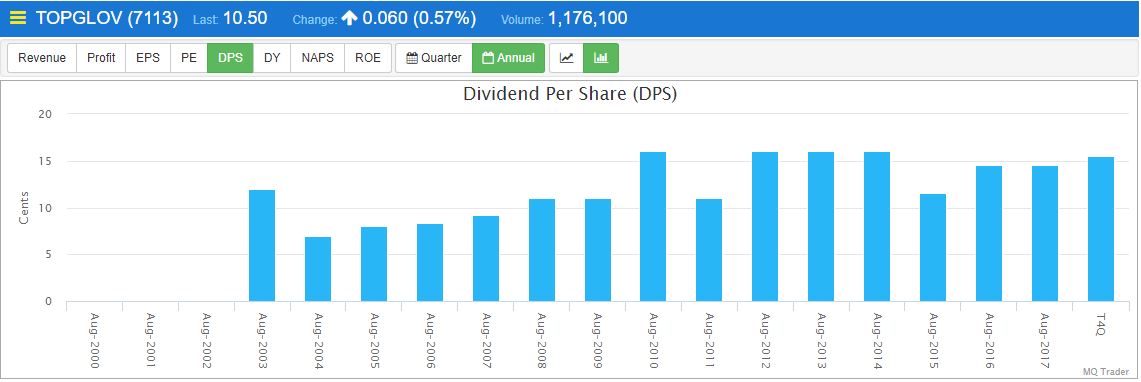
Figure 5: Annual DPS of TOPGLOV
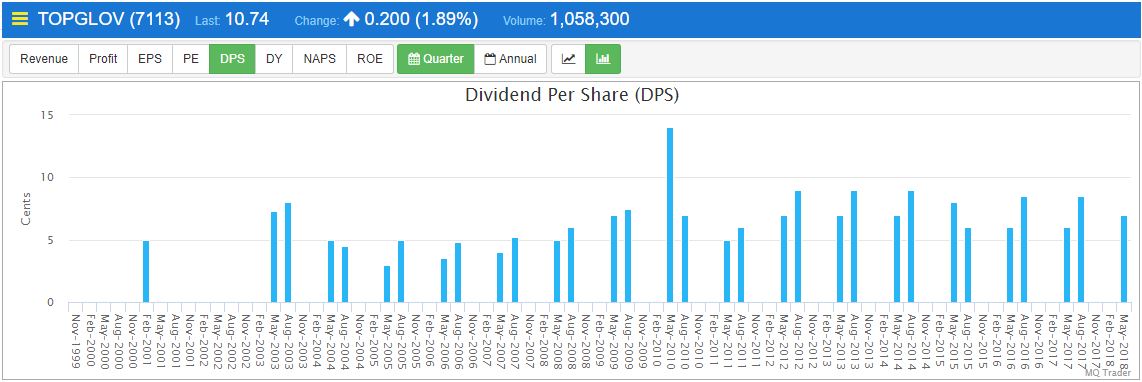
Figure 6: Quarter DPS of TOPGLOV
Figure 5 and 6 show that TOPGLOV has relatively high DPS which is a key indicator for those who are keen to earn income from company’s dividend.
To access into the DPS fundamental charts of TOPGLOV, please proceed to Annual DPS Chart of TOPGLOV to view the details.
Dividend yield (Div Yield), Net Asset Per Share (NAPS), Return of Equity (ROE) will be walked through in our next blog – MQ Trader – Fundamental Indicators [TOPGLOV] (Part 3).
Community Feedback
We encourage traders to try out and evaluate the MQ Trader system and provide us feedback on the features you like to see in the system. We have received many positive feedbacks so far, and we are currently compiling and reviewing them for possible inclusion into the next release of the system.
We would like to develop this system based on community feedback to cater for community needs. Thanks to all those who have provided valuable feedback to us. Keep those feedbacks coming in!
Disclaimer
This article does not represent a BUY or SELL recommendation on the stock covered. Traders and Investors are encouraged to do their own analysis on stocks instead of blindly following any Trading calls raised by various parties in the Internet. We may or may not hold position in the stock covered, or initiate new position in the stock within the next 7 days.
Join us now!
MQ Trader stock analysis system uses Artificial Intelligence (AI), various technical indicators and quantitative data to generate accurate trading signals without the interference of human's emotions and bias against any particular stock. It comprises trading strategies which are very popular among fund managers for analysing stocks.
MQ Trader stock analysis system is SPONSORED for MQ Trader members. To use this amazing tool, you can sign up via MQ Trader Sign Up!
Contact us
Please do not hesitate to contact us if you have any enquiry:
Email: service@mqtrader.com
Related Stocks
| Chart | Stock Name | Last | Change | Volume |
|---|
More articles on MQTrader Education Series

Is there a safe haven to invest in a recessionary environment?
Created by MQTrader Jesse | Apr 13, 2023
MQ Trader - Why trade in a stock market that has strong currency?
Created by MQTrader Jesse | Aug 06, 2021
MQ Trader - How to validate buy signals by using MQ Live Backtesting? [ECOWLD]
Created by MQTrader Jesse | Nov 01, 2019
Discussions
Be the first to like this. Showing 0 of 0 comments
Post a Comment
Featured Posts


Latest Videos


Apps


Top Articles
1
2
3
BFM Podcast
4
Mercury Securities Research
5
BFM Podcast
6
BFM Podcast
8
#
Stock
Score
Daily Stocks
Stock Name
Last
Change
Volume
Stock Name
Last
Change
Volume
Stock Name
Last
Change
Volume
Featured Advertisers / Partners


Ride The Bull Short The Bear
CS Tan
4.9 / 5.0
This book is the result of the author's many years of experience and observation throughout his 26 years in the stockbroking industry. It was written for general public to learn to invest based on facts and not on fantasies or hearsay....