


MQTrader Education Series
MQ Trader – Fundamental Indicators [TOPGLOV] (Part 3)

MQTrader Jesse
Publish date: Fri, 24 Aug 2018, 05:35 PM
Introduction
In this blog post, we will be continuing from where we stop in the previous blog post – MQ Trader – Fundamental Indicators [TOPGLOV] (Part 2) which explains the financial ratios (i.e Earnings Per Share, PE Ratio, Dividend Per Share) used in MQ Fundamental Charts. Dividend Yield, Net Asset Per Share and Return Of Equity will be discussed in this post.
Financial ratios
- Dividend Yield (Div Yield)
Dividend yield is a financial ratio that indicates how much a company pays out in dividends each year relative to its share price. It is represented in percentage which measures the return on investment for a stock.
Calculation of Dividend Yield:
![]()
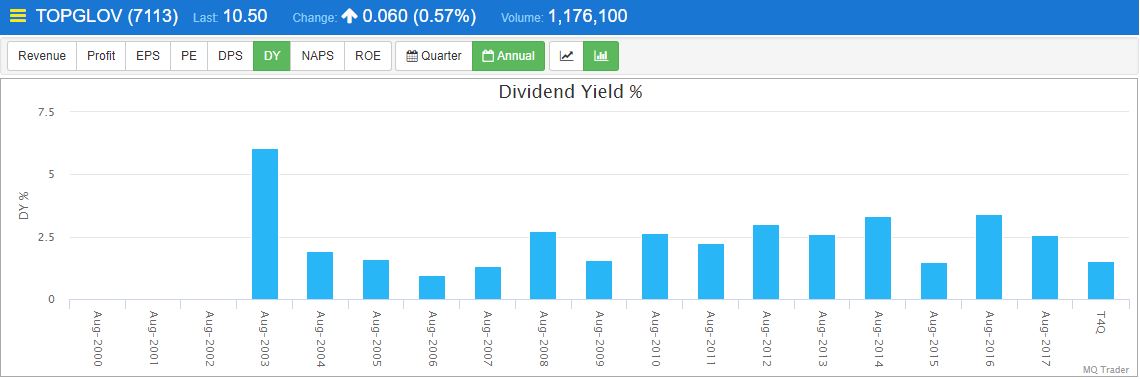
Figure 1: Annual dividend yield of TOPGLOV
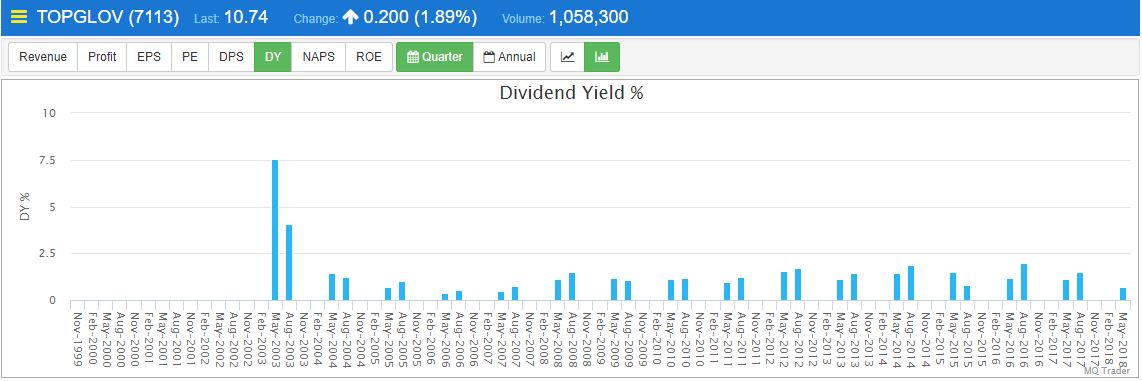
Figure 2: Quarter dividend yield of TOPGLOV
Figure 1 and 2 show that TOPGLOV has considerably high dividend yield over the years. For investors who are interested to earn income from companies’ dividend, should focus on this fundamental indicator.
- Net Asset Per Share (NAPS)
Net Asset per Share (NAPS) is known as the book value per share which is an expression for net asset value that represents the value per share of a mutual fund, exchange-traded fund (ETF) or a closed-end fund. If NAPS is higher than the share price, then the share will be considered as undervalued, as it means that the stock is traded at a cheaper price than its actual value.
Calculation of NAPS:
NAPS = Net Asset Value (NA) / Number of Shares Outstanding
Where NA = Assets – Liabilities
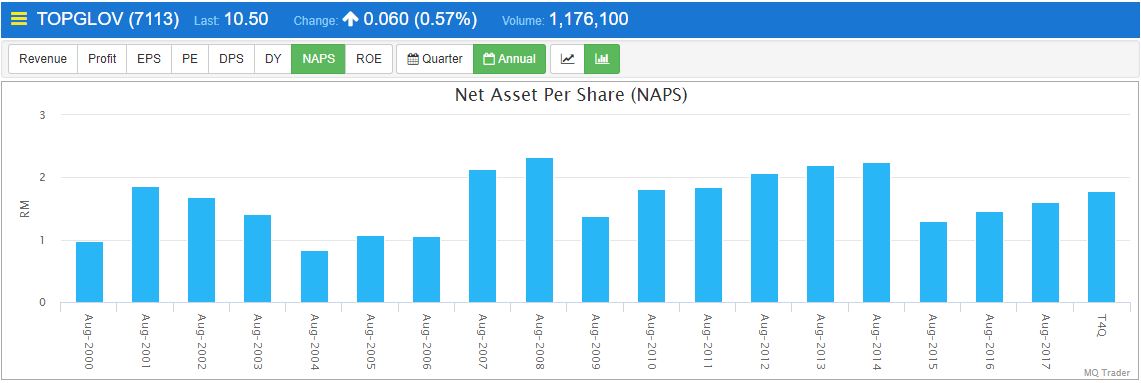
Figure 3: Annual NAPS of TOPGLOV
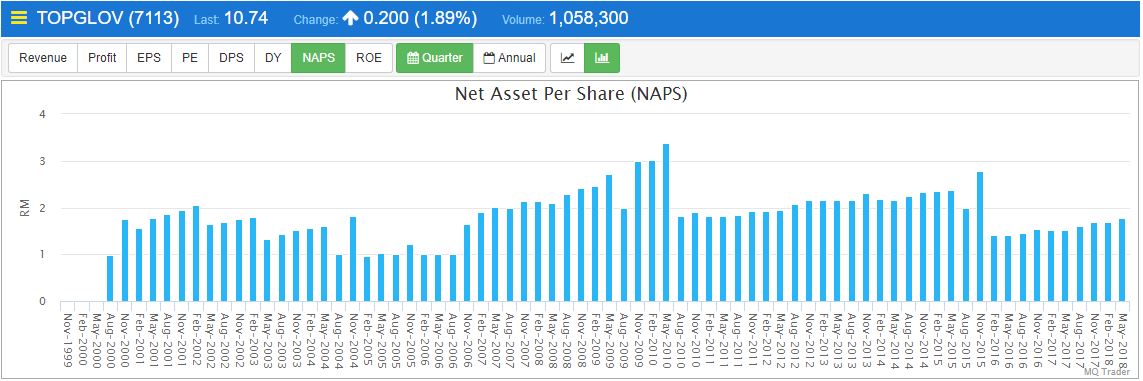
Figure 4: Quarter NAPS of TOPGLOV
Figure 3 and 4 show that TOPGLOV has low NAPS (1.78 in T4Q) which is lower than its share price. This indicates that it is not undervalued at the moment.
- Return of Equity (ROE)
Return on Equity (ROE) measures a company's profitability by revealing how much profit a company generates with the money shareholders have invested. A positive ROE means the shareholder's value have increased over time. The higher the return on equity, the more efficient the company's operations are making use of those funds.
Calculation of ROE:
Return on Equity = Net Income/Shareholder's Equity
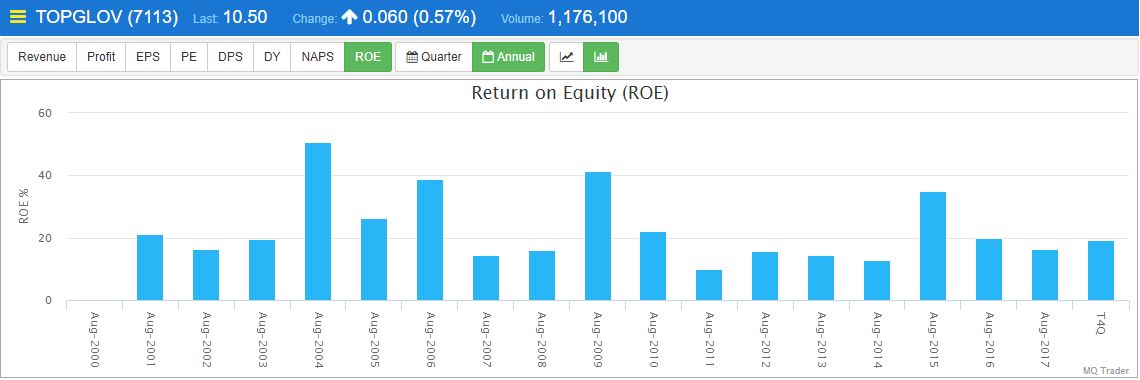
Figure 5: Annual ROE of TOPGLOV
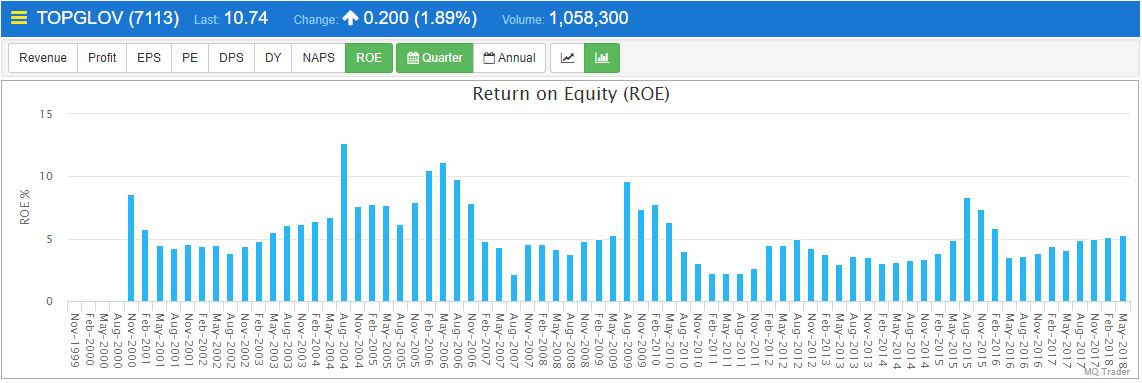
Figure 6: Quarter ROE of TOPGLOV
Figure 5 and 6 indicate that TOPGLOV has a high positive ROE over the years. Hence, it is increasing shareholders’ value throughout the years.
Conclusion
Fundamental indicators are powerful tools that are able to extract and simplify the financial data systematically. However, they have lagging effect because the financial data will only be generated once per quarter of a year when the financial reports are released. As a result, financial indicators are unable to provide information as fast as technical indicators. Despite all that, the financial indicators are useful to record the historical performance of a company, as history always repeats itself.
MQ Fundamental Screener which screens stocks based on fundamental indicators is also available in MQ Trader Stock Analysis System. For more information, please proceed to MQ Trader – Fundamental Screener.
Next, we will be discussing on the fundamental tests used in MQ Fundamental Analysis – MQ Trader – Fundamental Tests [TOPGLOV] (Part 1). Stay tuned!
Community Feedback
We encourage traders to try out and evaluate the MQ Trader system and provide us feedback on the features you like to see in the system. We have received many positive feedbacks so far, and we are currently compiling and reviewing them for possible inclusion into the next release of the system.
We would like to develop this system based on community feedback to cater for community needs. Thanks to all those who have provided valuable feedback to us. Keep those feedbacks coming in!
Disclaimer
This article does not represent a BUY or SELL recommendation on the stock covered. Traders and Investors are encouraged to do their own analysis on stocks instead of blindly following any Trading calls raised by various parties in the Internet. We may or may not hold position in the stock covered, or initiate new position in the stock within the next 7 days.
Join us now!
MQ Trader stock analysis system uses Artificial Intelligence (AI), various technical indicators and quantitative data to generate accurate trading signals without the interference of human's emotions and bias against any particular stock. It comprises trading strategies which are very popular among fund managers for analysing stocks.
MQ Trader stock analysis system is SPONSORED for MQ Trader members. To use this amazing tool, you can sign up via MQ Trader Sign Up!
Contact us
Please do not hesitate to contact us if you have any enquiry:
Email: service@mqtrader.com
Related Stocks
| Chart | Stock Name | Last | Change | Volume |
|---|
More articles on MQTrader Education Series
Is there a safe haven to invest in a recessionary environment?
Created by MQTrader Jesse | Apr 13, 2023
MQ Trader - Why trade in a stock market that has strong currency?
Created by MQTrader Jesse | Aug 06, 2021
MQ Trader - How to validate buy signals by using MQ Live Backtesting? [ECOWLD]
Created by MQTrader Jesse | Nov 01, 2019
Discussions
Be the first to like this. Showing 0 of 0 comments
Post a Comment
Featured Posts


Latest Videos


Apps


Top Articles
1
2
3
BFM Podcast
4
Mercury Securities Research
5
BFM Podcast
6
BFM Podcast
8
#
Stock
Score
Daily Stocks
Stock Name
Last
Change
Volume
Stock Name
Last
Change
Volume
Stock Name
Last
Change
Volume
Featured Advertisers / Partners


Ride The Bull Short The Bear
CS Tan
4.9 / 5.0
This book is the result of the author's many years of experience and observation throughout his 26 years in the stockbroking industry. It was written for general public to learn to invest based on facts and not on fantasies or hearsay....