


MQTrader Education Series
MQ Trader – Fundamental Tests [TOPGLOV] (Part 1)

MQTrader Jesse
Publish date: Mon, 27 Aug 2018, 05:35 PM
Introduction
Fundamental analysis can be a very boring task if you do not have the right tool to perform it efficiently and systematically. MQ Trader Stock Analysis System provides a platform for traders to carry out fundamental analysis by using a series of fundamental tests to determine whether the company is with good fundamentals.
According to our previous blog post – MQ Trader – Fundamental Indicators [TOPGLOV] (Part 1), we have walked through the fundamental indicators that we are using in performing MQ Fundamental Analysis. It is important to know how to make use of the fundamental indicators to identify the value of a stock.
In this article, we will be explaining on the fundamental tests that are used in MQ Trader Stock Analysis System to rate the stocks in terms of the companies’ performance by comparing the values of one or multiple fundamental indicators.
What is MQ Fundamental Test?
MQ Fundamental Test is an analysis technique used to evaluate the fundamentals of a company strictly based on a series of criteria set by MQ Trader. This series of criteria is created according to the common questions that appear in the mind of most investors when they are looking for stocks with good fundamentals.
TOPGLOV will be used for demonstration in this article. Figure below portrays the fundamental rating with its rating breakdown. To view TOPGLOV fundamental rating and its rating breakdown, please visit TOPGLOV's MQ Fundamental Analysis.
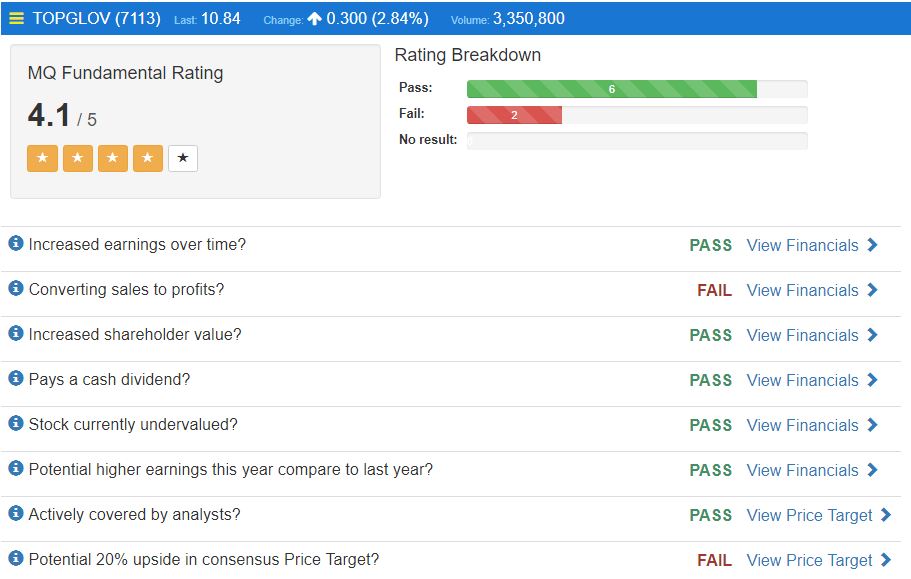
There are 8 fundamental tests which are applied in MQ fundamental analysis. In this article, we will be explaining the first 4 fundamental tests in MQ Trader Stock Analysis system:
- Increased earnings over time?
An established, well-run company should increase its earnings over time, even if that growth isn't as strong as younger, start-up companies that carry more risk.
To pass this criteria, a company must achieve earnings growth in 4 of the last 5 years, or at least 7 of the last 10 years.
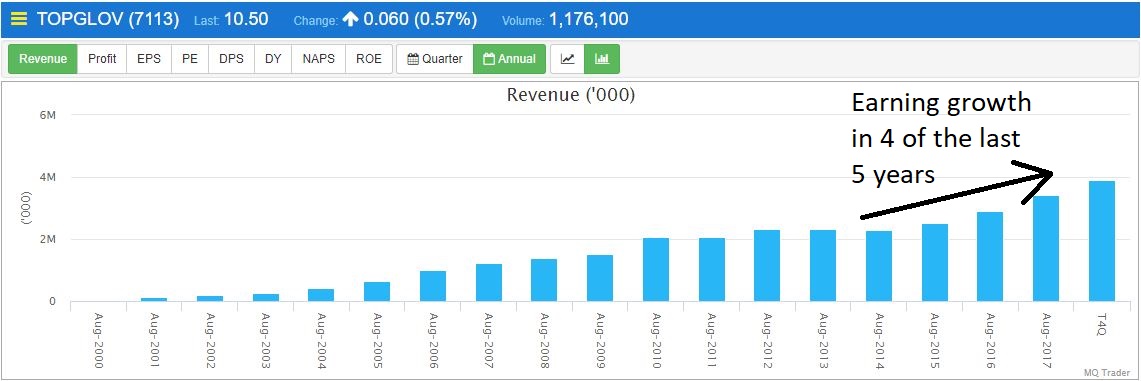
Figure 1: Annual Revenue chart of TOPGLOV
Figure 1 shows that TOPGLOV passes this requirement, as its revenue is increasing steadily over the past 4 years. To see the revenue chart of TOPGLOV, please visit TOPGLOV's Revenue Chart in MQ Trader.
2. Converting sales into profit?
Buffett has observed that companies with high-cost operations typically find ways to sustain or add to their costs. Every dollar spent unwisely deprives the owners of the business of a dollar of profit.
To pass this criteria, a company must achieve at least 20% profit over revenue in 4 of the last 5 years, or at least 7 out of the last 10 years.
Table 1: TOPGLOV’s percentage of profit over the past 10 years.
|
Financial Year |
Revenue (‘000) |
Profit (‘000) |
Percentage of Profit (%) |
|
31 Aug 2017 |
3,409,176 |
332,704 |
9.76 |
|
31 Aug 2016 |
2,888,515 |
360,729 |
12.49 |
|
31 Aug 2015 |
2,510,510 |
279,781 |
11.14 |
|
31 Aug 2014 |
2,275,366 |
180,523 |
7.93 |
|
31 Aug 2013 |
2,313,234 |
196,500 |
8.49 |
|
31 Aug 2012 |
2,314,454 |
202,726 |
8.76 |
|
31 Aug 2011 |
2,053,916 |
113,091 |
5.51 |
|
31 Aug 2010 |
2,079,432 |
245,231 |
11.79 |
|
31 Aug 2009 |
1,529,077 |
169,133 |
9.86 |
|
31 Aug 2008 |
1,377,931 |
110,065 |
10.08 |
Table 1 shows that TOPGLOV never achieve 20% of profit percentage for the past 10 years, so it fails this criteria. The full data of TOPGLOV's revenue and profit is available in MQ Trader Stock Analysis System. Please visit TOPGLOV's financial data in MQ Trader.
3. Increased shareholder value?
Return on Equity (ROE) measures a company's profitability by revealing how much profit a company generates with the money shareholders have invested. A positive ROE means the shareholder's value have increased over time.
To pass this criteria, a company must achieve minimum ROE of 10% in 4 of the last 5 years, or at least 7 out of the last 10 years.
Table 2: Annual ROE of TOPGLOV
|
Financial Year |
ROE (%) |
|
31 Aug 2017 |
16.49 |
|
31 Aug 2016 |
19.74 |
|
31 Aug 2015 |
34.85 |
|
31 Aug 2014 |
12.93 |
|
31 Aug 2013 |
14.48 |
|
31 Aug 2012 |
15.83 |
|
31 Aug 2011 |
9.89 |
|
31 Aug 2010 |
22.01 |
|
31 Aug 2009 |
41.55 |
|
31 Aug 2008 |
15.94 |
Table 2 shows that TOPGLOV’s ROE exceeds 10% in 9 out of last 10 years, so it passes this criteria and it increases the shareholders’ value over the time. To more about TOPGLOV's ROE, please view TOPGLOV's ROE in MQ Trader.
4. Pays a cash dividend?
A company doesn't need to increase dividends every year but it does need to reward shareholders by paying cash dividend consistently over time.
We like to see company pays dividend in at least 4 out of the last 5 years, or at least 7 out of the last 10 years.
Table 3: Annual Dividend of TOPGLOV
|
Financial Year |
DPS (Cent) |
Div Yield |
|
31 Aug 2017 |
14.50 |
2.58 |
|
31 Aug 2016 |
14.50 |
3.41 |
|
31 Aug 2015 |
11.50 |
1.49 |
|
31 Aug 2014 |
16.00 |
3.34 |
|
31 Aug 2013 |
16.00 |
2.61 |
|
31 Aug 2012 |
16.00 |
3.02 |
|
31 Aug 2011 |
11.00 |
2.26 |
|
31 Aug 2010 |
16.00 |
2.64 |
|
31 Aug 2009 |
11.00 |
1.58 |
|
31 Aug 2008 |
11.00 |
2.71 |
Table 3 shows the amount of dividend paid by TOPGLOV to shareholders every year. This shows that TOPGLOV distributes dividend constantly and it passes this requirement. To see the full information on TOPGLOV's dividend yield, please proceed to TOPGLOV's Dividend Yield in MQ Trader.
To continue reading the second part of this topic, kindly proceed to MQ Trader – Fundamental Tests [TOPGLOV] (Part 2).
Community Feedback
We encourage traders to try out and evaluate the MQ Trader system and provide us feedback on the features you like to see in the system. We have received many positive feedbacks so far, and we are currently compiling and reviewing them for possible inclusion into the next release of the system.
We would like to develop this system based on community feedback to cater for community needs. Thanks to all those who have provided valuable feedback to us. Keep those feedbacks coming in!
Disclaimer
This article does not represent a BUY or SELL recommendation on the stock covered. Traders and Investors are encouraged to do their own analysis on stocks instead of blindly following any Trading calls raised by various parties in the Internet. We may or may not hold position in the stock covered, or initiate new position in the stock within the next 7 days.
Join us now!
MQ Trader stock analysis system uses Artificial Intelligence (AI), various technical indicators and quantitative data to generate accurate trading signals without the interference of human's emotions and bias against any particular stock. It comprises trading strategies which are very popular among fund managers for analysing stocks.
MQ Trader stock analysis system is SPONSORED for MQ Trader members. To use this amazing tool, you can sign up via MQ Trader Sign Up!
Contact us
Please do not hesitate to contact us if you have any enquiry:
Email: service@mqtrader.com
Related Stocks
| Chart | Stock Name | Last | Change | Volume |
|---|
More articles on MQTrader Education Series
Is there a safe haven to invest in a recessionary environment?
Created by MQTrader Jesse | Apr 13, 2023
MQ Trader - Why trade in a stock market that has strong currency?
Created by MQTrader Jesse | Aug 06, 2021
MQ Trader - How to validate buy signals by using MQ Live Backtesting? [ECOWLD]
Created by MQTrader Jesse | Nov 01, 2019
Featured Posts
Introducing MY's First IPO Fund for Sophisticated Investors!
New Update. Discover investment communities that resonate with your ideas
M & A Value Partners IPO Equity Fund has been launched - Targeted 13% Return p.a
Latest Videos


Apps


Top Articles
1
2
3
BFM Podcast
4
Mercury Securities Research
5
BFM Podcast
6
BFM Podcast
8
#
Stock
Score
Daily Stocks
Stock Name
Last
Change
Volume
Stock Name
Last
Change
Volume
Stock Name
Last
Change
Volume
Featured Advertisers / Partners


Ride The Bull Short The Bear
CS Tan
4.9 / 5.0
This book is the result of the author's many years of experience and observation throughout his 26 years in the stockbroking industry. It was written for general public to learn to invest based on facts and not on fantasies or hearsay....
ngyuzhi
Good analysis write up. Thanks for sharing.
2018-08-27 19:31