


MQTrader Education Series
MQ Trader – Fundamental Tests [TOPGLOV] (Part 2)

MQTrader Jesse
Publish date: Tue, 28 Aug 2018, 05:15 PM
Introduction
This blog post in the continuation of our previous post – MQ Trader – Fundamental Tests [TOPGLOV] (Part 1), so it is recommended to read our previous post to have a better understanding on MQ Fundamental Tests.
In this article, we will be focusing on the other 4 MQ Fundamental tests.
MQ Fundamental Tests
- Stock currently undervalued?
Anything with a PE over 15 looks unattractive based on price. The only exception that we allow to our PE rule is for growth stocks with consistent records of rising earnings. If a company's earnings are advancing faster than the market average, it can command a higher-than-average price/earnings ratio.
Table 4: Annual PE ratio of TOPGLOV
|
Financial Year |
PE |
|
31 Aug 2017 |
21.13 |
|
31 Aug 2016 |
14.74 |
|
31 Aug 2015 |
17.04 |
|
31 Aug 2014 |
16.46 |
|
31 Aug 2013 |
19.36 |
|
31 Aug 2012 |
16.14 |
|
31 Aug 2011 |
26.57 |
|
31 Aug 2010 |
15.24 |
|
31 Aug 2009 |
12.12 |
|
31 Aug 2008 |
10.92 |
TOPGLOV passes this section and it is not undervalued at the moment, as it has rising earnings over the years despite of its PE ratio which is higher than 15. The full data of TOPGLOV's PE ratio can be viewed through TOPGLOV's PE Ratio in MQ Trader.
- Potential higher earnings this year compare to last year?
A company with potentially high earnings this year compare to the previous year will likely lead to increasing share price.
To pass this criteria, a company must achieve higher T4Q (last 4 quarters) earnings (or latest reported annual earnings) compare to the previous year's earnings.
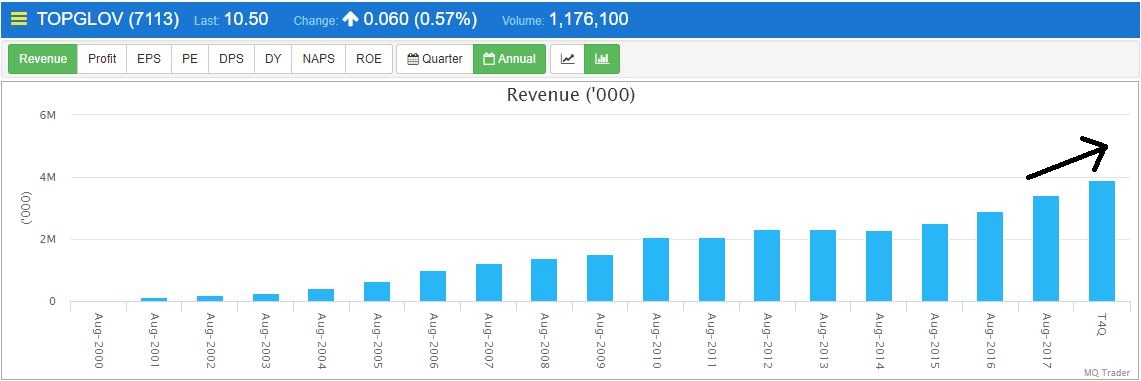
Figure 2: Annual Revenue of TOPGLOV
Figure 2 shows that TOPGLOV’s revenue in T4Q is higher than the last financial year’s, so it passes this criteria and it has potential higher earnings this year compared to last year.
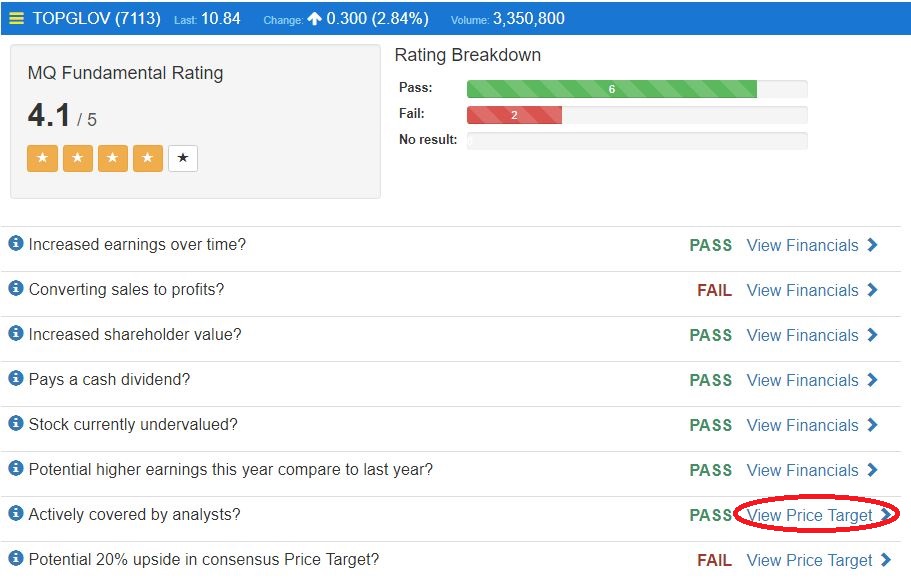
3. Actively covered by analysts?
A stock that is fairly caught on by investors and has sufficient liquidity will attract coverage by analysts.
To pass this criteria, a company must be covered by 5 or more different analysts in the past 6 months
Source: MQ Trader Stock Analysis System
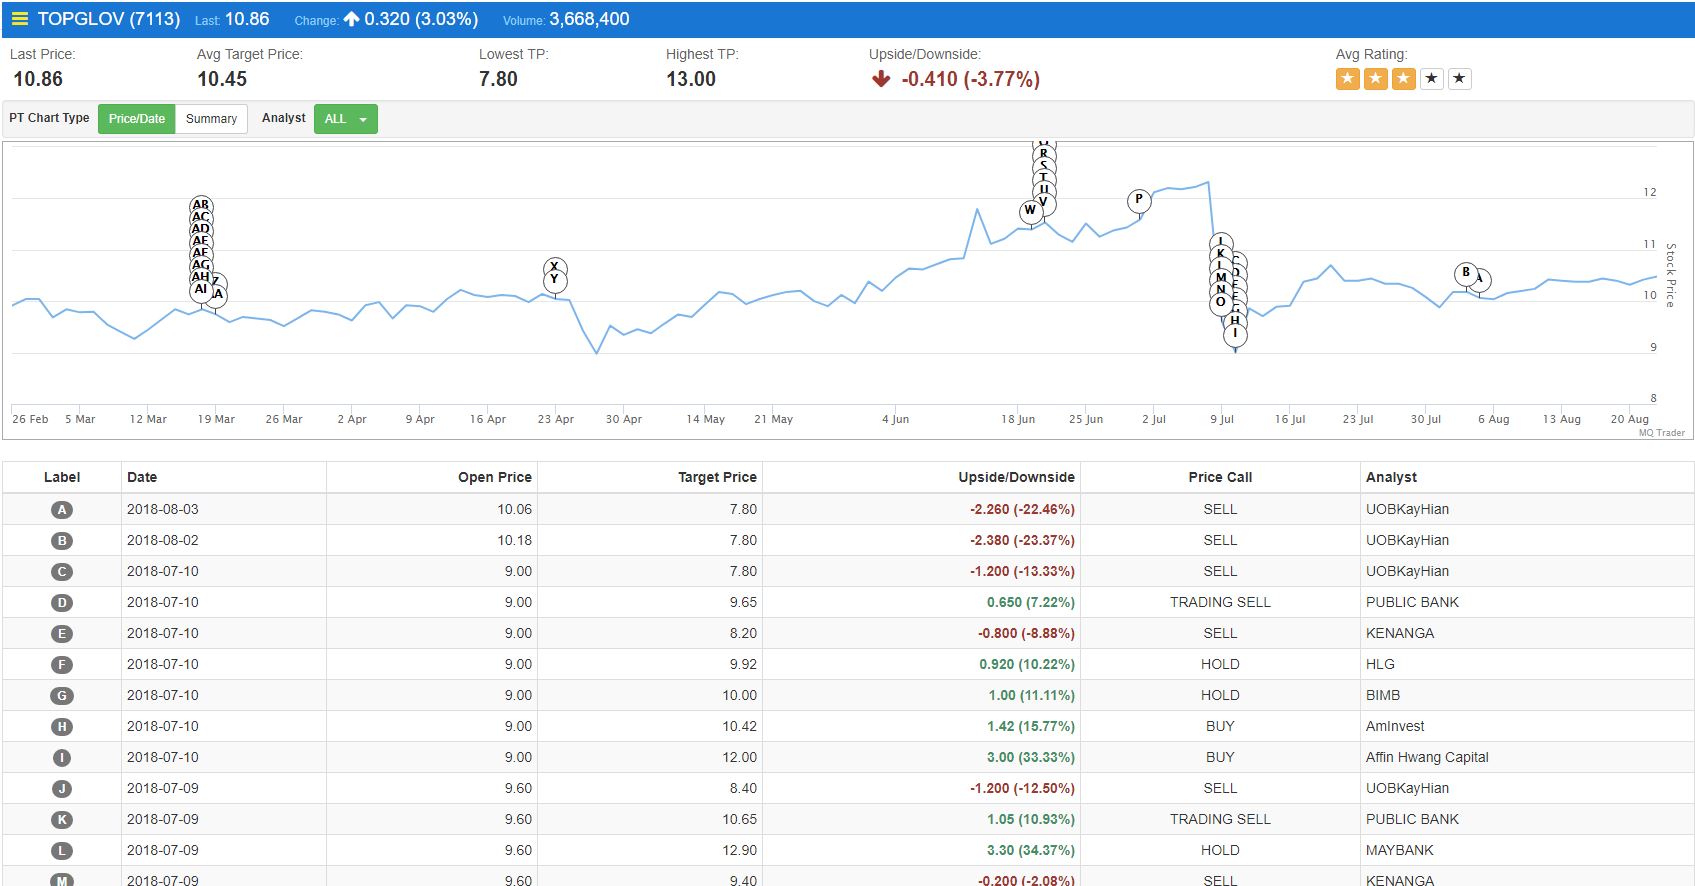
Figure 3: Price Target of TOPGLOV
Price target of TOPGLOV can be viewed by clicking onto “View Price Target” on MQ Fundamental Rating page. Then, the number of analysts who cover TOPGLOV with price target can be found in the list as shown in Figure 3. Hence, TOPGLOV passes this requirement, as it is actively covered by a number of analysts.
4. Potential 20% upside in consensus Price Target?
Consensus price target from multiple analysts provides a good guidance on the natural ceiling price of a stock. A stock with high potential upside (concensus price target minus current stock price) offers good opportunity and a margin of safety to invest in the stock.
To pass this criteria, the concensus price target must be derived from at least 3 different analysts, and at least 20% above the current stock price.
![]()
Figure 4: Target price provided by UOBKayHian, PUBLIC BANK and KENANGA.
TOPGLOV fails this section, as the most recent target prices provided by 3 different analysts including UOBKayHian, PUBLIC BANK and KENANGA are lower than TOPGLOV’s share price.
Overall, TOPGLOV is considered as a company with good fundamentals, as it passes 6 out of 8 fundamental tests. It scores 4.1/5.0 for its MQ Fundamental Rating which is explained in MQ Trader – Fundamental Analysis [TOPGLOV].
Conclusion
Complicated and lengthy calculations can be avoided, as MQ Fundamental analysis tool is able to extract and tabulate financial data accordingly. Moreover, the data is processed to calculate various financial ratios which are used for comparison in MQ Fundamental Tests to determine the performance of a particular company over the time. Hence, we can avoid capitals from trapping into penny stocks or stocks with poor fundamentals to maximize our capital gain within a short time.
Fundamental Screener is available in MQ Trader Stock Analysis System to screen stocks with good fundamentals within a few seconds. If you are interested to know more about MQ Fundamental Screener, please proceed to MQ Trader – Fundamental Screener.
Community Feedback
We encourage traders to try out and evaluate the MQ Trader system and provide us feedback on the features you like to see in the system. We have received many positive feedbacks so far, and we are currently compiling and reviewing them for possible inclusion into the next release of the system.
We would like to develop this system based on community feedback to cater for community needs. Thanks to all those who have provided valuable feedback to us. Keep those feedbacks coming in!
Disclaimer
This article does not represent a BUY or SELL recommendation on the stock covered. Traders and Investors are encouraged to do their own analysis on stocks instead of blindly following any Trading calls raised by various parties in the Internet. We may or may not hold position in the stock covered, or initiate new position in the stock within the next 7 days.
Join us now!
MQ Trader stock analysis system uses Artificial Intelligence (AI), various technical indicators and quantitative data to generate accurate trading signals without the interference of human's emotions and bias against any particular stock. It comprises trading strategies which are very popular among fund managers for analysing stocks.
MQ Trader stock analysis system is SPONSORED for MQ Trader members. To use this amazing tool, you can sign up via MQ Trader Sign Up!
Contact us
Please do not hesitate to contact us if you have any enquiry:
Email: service@mqtrader.com
Related Stocks
| Chart | Stock Name | Last | Change | Volume |
|---|
More articles on MQTrader Education Series
Is there a safe haven to invest in a recessionary environment?
Created by MQTrader Jesse | Apr 13, 2023
MQ Trader - Why trade in a stock market that has strong currency?
Created by MQTrader Jesse | Aug 06, 2021
MQ Trader - How to validate buy signals by using MQ Live Backtesting? [ECOWLD]
Created by MQTrader Jesse | Nov 01, 2019
Discussions
Be the first to like this. Showing 0 of 0 comments
Post a Comment
Featured Posts


Latest Videos


Apps


Top Articles
1
2
3
BFM Podcast
4
Mercury Securities Research
5
BFM Podcast
6
BFM Podcast
8
#
Stock
Score
Daily Stocks
Stock Name
Last
Change
Volume
Stock Name
Last
Change
Volume
Stock Name
Last
Change
Volume
Featured Advertisers / Partners


Ride The Bull Short The Bear
CS Tan
4.9 / 5.0
This book is the result of the author's many years of experience and observation throughout his 26 years in the stockbroking industry. It was written for general public to learn to invest based on facts and not on fantasies or hearsay....