


Positive Trade.
YOCB - Beautiful Chart, Potential Breakout.

Foresight123
Publish date: Tue, 26 Aug 2014, 12:13 AM
Foresight123
0 12
Disclaimer: All data and information provided on this article and blog is for informational purposes only. I make no representations as to completeness of information and will not be held liable for any losses.
Please visit my blog at http://positivetrade.blogspot.com/ for more interesting updates
Please visit my blog at http://positivetrade.blogspot.com/ for more interesting updates
Technical Analysis On YOCB
(source : tradesignum.com)
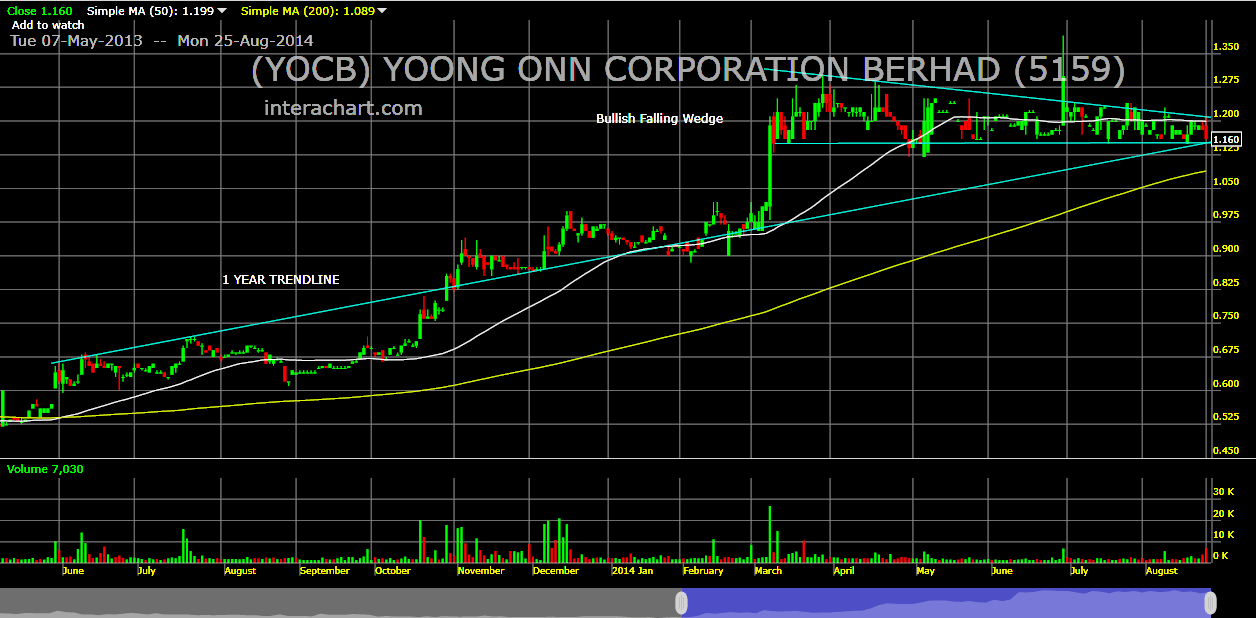
YOCB has gone through a healthy bullish consolidation ( falling wedge) since March 2014.
The price of this stock has touched the RM 1.15 level (trendline support).
This beautiful one year trendline has became the support and resistance of this stock MULTIPLE times.
This time, the trendline looks like a trampoline to the upside to the immediate resistance of RM 1.30.
Immediate resistance: RM 1.30
Support level : RM 1.10 (Stop-loss order is recommended)
Should the RM 1.30 resistance be broken this stock might rise higher to a psychological resistance of RM1.50
http://klse.i3investor.com/quoteservlet.jsp?sa=ss&q=YOCB
Note: Trade at your own risk.
Related Stocks
| Chart | Stock Name | Last | Change | Volume |
|---|
Market Buzz
More articles on Positive Trade.
Hibiscus Petroleum - HIGHLY UNDERVALUED DESPITE GLORY DAYS TO COME
Created by Foresight123 | Aug 19, 2014
Discussions
Be the first to like this. Showing 0 of 0 comments
Post a Comment
Featured Posts


Latest Videos


Apps


Top Articles
1
2
南洋行家论股
3
AmInvest Research Reports
4
CEO Morning Brief
Oriental Kopi to Raise Menu Prices Amid Rising Raw Material Costs
5
Good Articles to Share
Trudeau’s exit, Musk v Starmer, Nvidia’s new tech and Biden’s drilling ban
6
Good Articles to Share
Powerful earthquake kills dozens in Tibet, rattles Nepal | REUTERS
7
Good Articles to Share
CES 2025: Sony Afeela electric vehicle starts at $89,900 | REUTERS
8
Good Articles to Share
#
Stock
Score
Daily Stocks
Stock Name
Last
Change
Volume
Stock Name
Last
Change
Volume
Stock Name
Last
Change
Volume
Featured Advertisers / Partners


Ride The Bull Short The Bear
CS Tan
4.9 / 5.0
This book is the result of the author's many years of experience and observation throughout his 26 years in the stockbroking industry. It was written for general public to learn to invest based on facts and not on fantasies or hearsay....