SEE_Research

NOW SHOWING: THE TRILOGY OF FAST & FURIOUS SHOW / Corporate Exercise /Part 4 D ANCOM/4758 & NYLEX/4944

SEE_Research
Publish date: Sat, 31 Jul 2021, 10:33 AM
Predicting KLSE market uptrends

NOW SHOWING: THE TRILOGY OF FAST & FURIOUS SHOW /

 Part 4 D  ANCOM/4758 

&              NYLEX/4944

Author: SEE_Research    |    Publish date: 1 August 2021 


 ===========================================

BERNAMA .com


News in Brief 

29 July 2021


===========================


Nylex ( Malaysia ) Berhad /4944

returned to black
with huge profit of
RM 19.31 millions  for the current financial year 2021 
 
 
against a net loss of RM 23.21 millions in the previous financial year. 


  •  
    •  
    •  
    •  
      •  
      •  
      •  
  •  
      •  
      •  
      •  
      •  
      •  
    •  
      •  
      •  
    •  
    •  
    •  
    •  
 
Norway
Get To Know Us


  •  
    •  
    •  
    •  
      •  
      •  
      •  
  •  
      •  
      •  
      •  
      •  
      •  
    •  
      •  
      •  
    •  
    •  
    •  
    •  
 

ABOUT US arrow_icon CORPORATE PROFILE

Nylex (Malaysia) Berhad ("Nylex") is a public limited liability company, incorporated and domiciled in Malaysia and listed on the Main Market of Bursa Malaysia Securities Berhad in 1990.


Today, it has emerged as a dominant player in the petrochemicals, industrial and specialty chemicals, plastics and polymers business with an annual turnover of more than RM1.3 billion and over 16 subsidiaries operating mainly in Malaysia, Singapore, Indonesia and Vietnam.


Nylex is principally involved in investment holding and the manufacturing and marketing of vinyl-coated fabrics, calendered film and sheeting, rotomoulded plastic products, and other plastic products, including geotextiles, prefabricated sub-soil drainage systems, bulk chemical containers, road barriers, playground equipment and disposal bins.


Nylex's subsidiaries involved in distribution, trading, manufacturing and sale of petrochemicals and industrial chemical products and manufacture and marketing of polyvinyl chloride (more commonly known as PVC) and polyurethane ("PU") synthetic leather, films and sheets and carrying out business of transport, cartage and haulage contractors and agencies, ship owning, ship management and charter hire of tanker.


Nylex's products are widely sold to Europe, the Middle East, Africa more than 15 countries in Asia Pacific including Oceania.


===========================


 By Chan Wai Kit
Fri, 30 July 2021, 8:48 am

Ancom posts best results since 2008 with RM23.9m FY21 net profit


Chan Wai Kit
Fri, 30 July 2021, 8:48 am·2-min read
 
 
Ancom Berhad recorded strong fourth quarter and full-year financial results for the period ended May 31, 2021. — Picture courtesy of Ancom Berhad

KUALA LUMPUR, July 30 — Ancom Berhad recorded strong fourth quarter and full-year financial results for the period ended May 31, 2021 amid a highly challenging operating environment.

In a statement, the leading manufacturer and supplier of agricultural and industrial chemicals in South-east Asia said its 4QFY21 revenue increased 44.1 per cent year-on-year to RM445.9 million compared to RM309.4 million in the same period last year.

It said the improvement was primarily driven by the agricultural chemicals segment as higher global demand bolstered the segmental top line by 28.6 per cent to RM79.9 million.


Higher trading volume and average selling prices also boosted the revenue of the industrial chemicals arm by 52.6 per cent y-o-y to RM325.1 million, the group added.

Ancom’s profit after tax and non-controlling interest also jumped to RM7.6 million in 4QFY21 versus a loss of RM11.8 million a year ago.

For the full year, Ancom’s revenue increased marginally by 4.5 per cent y-o-y to RM1.54 billion in FY21.

Meanwhile, the Group reported full-year net profit of RM23.9 million for FY21, which Ancom Berhad Group CEO Lee Cheun Wei noted was its best full-year bottom line since 2008.

“Our agricultural chemicals division has done very well, riding on the uptrend of global demand for food. We anticipate the trend to persist with a continued strong contribution from this segment. As for the industrial chemicals segment, our trading business has performed favourably too, having benefited from higher sales volume and generally higher average selling prices,” he said.

Given the restrictions in operations imposed during MCO/EMCO in the months of June and July, we have been very vigilant to comply with regulations while continuing to serve our clients as an integral part of the food supply chain. We are cognisant of the ongoing challenges such as freight costs and supply chain disruptions due to the pandemic, and we managed to deliver commendable results thus far.”

Lee added that he anticipates the growth trajectory of the Group, particularly the agricultural chemicals division, to remain strong.

“Recently, we have begun our production of new active ingredients at our existing plants and are expecting to add a few more to our portfolio once our new plant is ready by the first half of 2022. We are optimistic and will strive to continue to deliver good and satisfactory results for our shareholders next year,” he concluded.

Related Articles Ancom says Nylex’s board has accepted RM179.3m buyout offer Source: Ancom in bid to fully acquire Nylex Ancom Bhd untung lima kali ganda, meningkat RM9.3 juta


As the World Health Organization (WHO) announced Covid-19 outbreak as a pandemic,


 glove stocks naturally became attractive to KLSE investors.


  • WORLD 
  • COVID-19
  • WITH THE DELTA CORONAVIRUS VARIANT SWEEPING ACROSS ASIA, EXPERTS SAY MORE NEEDS TO BE DONE 

With the Delta Coronavirus Variant Sweeping Across Asia, Experts Say More Needs to Be Done

A medical worker takes a nasal sample from a man during a COVID-19 testing at a makeshift testing site at the National Assembly in Seoul, South Korea, Thursday, July 15, 2021.
 
AP Photo/Ahn Young-joon
JULY 15, 2021 3:51 AM EDT

JAKARTA, Indonesia — As many Asian countries battle their worst surge of COVID-19 infections, the slow-flow of vaccine doses from around the world is finally picking up speed, giving hope that low inoculation rates can increase and help blunt the effect of the rapidly spreading delta variant.

With many vaccine pledges still unfulfilled and the rates of infection spiking across multiple countries, however, experts say more needs to be done to help nations struggling with the overflow of patients and shortages of oxygen and other critical supplies.

Some 1.5 million doses of the Moderna vaccine were set to arrive Thursday afternoon in Indonesia, which has become a dominant hot spot with a record high infections and deaths.

The U.S. shipment comes in addition to 3 million other American doses that arrived Sunday, and 11.7 million doses of AstraZeneca that have come in batches since March through the U.N.-backed COVAX mechanism, the last earlier this week.

“It’s quite encouraging,” said Sowmya Kadandale, health chief in Indonesia of UNICEF, which is in charge of the distribution of vaccines provided through COVAX. “It seems now to be, and not just in Indonesia, a race between the vaccines and the variants, and I hope we win that race.”

Many, including the World Health Organization, have been critical of the vaccine inequalities in the world, pointing out that many wealthy nations have more than half of their populations at least partially vaccinated, while the vast majority of people in lower-income countries are still waiting on a first dose.

The International Red Cross warned this week of a “widening global vaccine divide” and said wealthy countries needed to increase the pace of following through on their pledges.

“It’s a shame it didn’t happen earlier and can’t happen faster,” Alexander Matheou, the Asia-Pacific director of the Red Cross, said of the recent uptick in deliveries. “There’s no such thing as too late — vaccinating people is always worth doing — but the later the vaccines come, the more people will die.”

Vietnam, Thailand and South Korea have all imposed new lockdown restrictions over the past week as they struggle to contain rapidly rising infections amid sluggish vaccination campaigns.

In South Korea — widely praised for its initial response to the pandemic that included extensive testing and contact tracing — a shortage in vaccines has left 70% of the population still waiting for their first shot. Thailand, which only started its mass vaccination in early June, is seeing skyrocketing cases and record deaths, and only about 15% of people have had at least one shot. In Vietnam, only about 4% have.

“Parts of the world … are talking about reclaiming lost freedoms such as going back to work, opening the cinemas and restaurants,” Matheou told The Associated Press. “This part of the world is far away from that.”

“Both Moderna and AstraZeneca have been really critical in ramping up these numbers and ensuring that the supplies are available,” said UNICEF’s Kadandale, noting that Indonesia plans to have some additional 208.2 million people vaccinated by year’s end and is giving 1 million shots daily. “Every single dose does make a huge difference.”

Many other countries in the region have vaccination rates far below Indonesia’s for a variety of reasons, including production and distribution issues as well as an initial wait-and-see attitude from many early on when numbers were low and there was less of a sense of urgency.

Some were shocked into action after witnessing the devastation in India in April and May as the country’s health system collapsed under a severe spike in cases that caught the government unprepared and led to mass fatalities.

At the same time, India — a major regional producer of vaccines — stopped exporting doses so that it could focus on its own suffering population.

The U.S. has sent tens of millions of vaccine doses to multiple countries in Asia recently, part of President Joe Biden’s pledge to provide 80 million doses, including Vietnam, Laos, South Korea and Bangladesh. The U.S. plans to donate an additional 500 million vaccines globally in the next year, and 200 million by the end of 2021.

“Indonesia is a critical partner for U.S. engagement in Southeast Asia and the vaccines come without strings attached,” said Scott Hartmann, a spokesman for the U.S. Embassy in Jakarta. “We’re doing this with the object of saving lives and ending the global pandemic, and equitable global access to safe and effective vaccines is essential.”

Earlier in the week, German Foreign Minister Heiko Maas, whose country is one of the largest financial backers of COVAX, accused Russia and China of using their delivery of vaccines for policy leverage.

“We note, in particular with China, that the supply of vaccines was also used to make very clear political demands of various countries,” he said, without providing specific examples.

There are also growing questions about the effectiveness of China’s Sinovac vaccine against the delta variant of the virus.

Thai officials said that booster doses of AstraZeneca would be given to front-line medical personnel who earlier received two doses of Sinovac, after a nurse who received two doses of Sinovac died Saturday after contracting COVID-19.

Sinovac has been authorized by WHO for emergency use but Indonesia also said it was planning boosters for health workers, using some of the newly delivered Moderna doses, after reports that some of the health workers who had died since June had been fully vaccinated with the Chinese shot.

“We have still found people getting severe symptoms or dying even when they are vaccinated,” Pandu Riono, an epidemiologist with the University of Indonesia, said about the Sinovac shot. “It’s only proven that some vaccines are strong enough to face the delta variant — AstraZeneca, Moderna and Pfizer seem capable.”

While the majority of recent deliveries have been American, Japan was sending 1 million doses of AstraZeneca on Thursday each to Indonesia, Taiwan and Vietnam as part of bilateral deals, and Vietnam said it was receiving 1.5 million more AstraZeneca doses from Australia.

The Philippines is expecting a total of 16 million doses in July, including 3.2 million from the U.S. later this week, 1.1 million from Japan, 132,000 of Sputnik V from Russia, as well as others through COVAX.

Japan is also is sending 11 million through COVAX this month to Bangladesh, Cambodia, Iran, Laos, Nepal, Sri Lanka, and others. Canada this week committed an additional 17.7 million surplus doses to the 100 million already pledged through COVAX, which is coordinated by Gavi, a vaccine alliance.

In addition to distributing some donated vaccines, financial contributions to COVAX also help fund the purchase of doses to distribute for free to 92 low or moderate income nations.

Earlier this month, it took blistering criticism from the African Union for how long it was taking for vaccines to reach the continent, which noted that just 1% of Africans are fully vaccinated.


===============================================

SEE_Research  - new report with details  on the following corporate exercise by

 ANCOM & NYLEX 


***** *ANCOM

to acquire balance 49% of NYLEX's business

Ancom is undergoing a major corporate consolidation exercise to house its 2 major business divisions,  Agrochem & Industrial Chemical,
under one roof.

Pre-consol:
Own 51% Nylex listed co (with business)

Post-consol:
Own 51% Nylex listed co (without business)
+ 100% of all Nylex business under Ancom

(Note: NOT buying over Nylex shares, only assets and liabilities of Nylex)


NYLEX / 4944
What will the Nylex minority obtain ?
GOOD NEWS
GOOD NEWS
GOOD NEWS

▪️Nylex shares still remaiN

▪️ rewards in cash in RM *****   ( + plus )* rewards in Ancom shares


BE PART OF AN ENLARGED CHEMICAL GROUP THAT OWNS BOTH
INDUSTRIAL CHEMICALS BUSINESS +
AGROCHEM BUSINESS


WHY THERE IS SUCH NEED TO HAVE THIS CORPORATE CONSOLIDATION EXERCISE


NYLEX WAS LOSS-MAKING THE PAST 2 YEARS, BUT PETROCHEMICAL PRICES HAVE PROGRESSIVELY RECOVERED AND
NYLEX IS POISED TO TAKE ADVANTAGE WITH THE POSITIVE UPTREND IN INCREASING REVENUES, WITH PROFITS  IN TURNING AROUND


ANCOM DILUTE ONLY 10-11%
(SIMILAR TO DOING PRIVATE PLACEMENTS EXERCISES )
TO CONSOLE 100% PROFIT OF NYLEX


PETROCHEMICAL BUSINESS IS ON THE UPTREND, AS CLEARLY IS EVIDENT IN THE RECENT RESULTS OF PETROCHEM INDUSTRY PLAYERS
(EXAMPLE :
L C TITAN, OTHERS)


ANCOM TO HAVE A RECORD YEAR, FOR PROFIT RETURN - THIS FY21
(ONLY CONSOL 51% OF NYLEX PROFIT).


THE COMING YEAR TO BE EVEN BETTER, EXCITING IN PROFIT GROWTH 
(CONSOLIDATION OF 100% OF NYLEX PROFIT).

==========================================================

NYLEX (4944) S

NYLEX (MALAYSIA) BERHAD Summary

0.845 

+0.005 (+0.60%)

Recent Prices

Date Open Range Close Change Volume
30/07/2021 0.86 0.845 - 0.865 0.845 +0.005 (0.60%) 1,069,100
29/07/2021 0.84 0.835 - 0.84 0.84 0.00 (0.00%) 114,000
28/07/2021 0.835 0.835 - 0.85 0.84 +0.005 (0.60%) 211,200
27/07/2021 0.84 0.835 - 0.845 0.835 -0.005 (0.60%) 202,200
26/07/2021 0.835 0.83 - 0.855 0.84 0.00 (0.00%) 496,900
23/07/2021 0.835 0.835 - 0.84 0.84 0.00 (0.00%) 30,600
22/07/2021 0.84 0.83 - 0.845 0.84 +0.005 (0.60%) 172,800
21/07/2021 0.84 0.825 - 0.84 0.835 -0.005 (0.60%) 173,700
19/07/2021 0.84 0.83 - 0.84 0.84 0.00 (0.00%) 97,200
16/07/2021 0.835 0.83 - 0.84 0.84 +0.005 (0.60%) 159,500
15/07/2021 0.83 0.825 - 0.835 0.835 +0.005 (0.60%) 211,600
14/07/2021 0.83 0.83 - 0.845 0.83 -0.01 (1.19%) 52,600
13/07/2021 0.855 0.83 - 0.855 0.84 -0.01 (1.18%) 154,500
12/07/2021 0.83 0.825 - 0.85 0.85 +0.02 (2.41%) 391,700
09/07/2021 0.83 0.83 - 0.835 0.83 0.00 (0.00%) 178,400
08/07/2021 0.84 0.83 - 0.84 0.83 -0.01 (1.19%) 661,900
07/07/2021 0.845 0.84 - 0.855 0.84 -0.005 (0.59%) 386,400
06/07/2021 0.85 0.845 - 0.855 0.845 -0.005 (0.59%) 431,300
05/07/2021 0.87 0.845 - 0.87 0.85 -0.015 (1.73%) 896,600
02/07/2021 0.85 0.845 - 0.865 0.865 +0.015 (1.76%) 585,500


RSI(14) Neutral 52.2
Stochastic(14) Neutral 50.0
Average Volume 599,000
Relative Volume 1.8

Main Market : Chemicals
High 0.865
Low 0.845
Volume 1,069,100
Volume (B/S) 10,000 / 6,800
Price Bid/Ask 0.845 / 0.850
   
52w 0.517 - 0.945
ROE 5.71
P/E 9
EPS 9.93
DPS  
DY 0.00%
   
NTA 1.7400
P/B 0.49
RPS 592.62
PSR 0
Market Cap 164.2M
Shares (mil) 194.34
TopQ QoQ ConQ YoY RTopQ RQoQ RConQ RYoY
RSI(14) Neutral 52.2
Stochastic(14) Neutral 50.0
Average Volume 599,000
Relative Volume 1.8


EPS DPS NTA Revenue P/L Quarter Q Date Financial Year Announced QoQ% YoY% Report
6.36 0.000 1.7400 353.31m 11.40m 4 2021-05-31 31 May, 2021 2021-07-29 130.7% 161% View
2.76 0.000 1.6700 289.06m 4.94m 3 2021-02-28 31 May, 2021 2021-04-28 10.1% 234.5% View
2.56 0.000 1.7000 263.39m 4.49m 2 2020-11-30 31 May, 2021 2021-01-26 395.5% 1561.5% View
-0.84 0.000 1.6700 245.92m -1.52m 1 2020-08-31 31 May, 2021 2020-10-27 91.9% 34.9% View
-10.68 0.000 1.7000 230.68m -18.68m 4 2020-05-31 31 May, 2020 2020-07-30 408.4% 14467.7% View
-2.10 0.000 1.8400 275.34m -3.67m 3 2020-02-29 31 May, 2020 2020-05-14 1460.7% 45.6% View
0.15 0.000 1.8700 315.72m 270.00k 2 2019-11-30 31 May, 2020 2020-01-21 124% 29.2% View
-0.63 0.000 1.8500 314.57m -1.13m 1 2019-08-31 31 May, 2020 2019-10-29 965.4% 136.5% View
0.07 1.000 1.8300 380.28m 130.00k 4 2019-05-31 31 May, 2019 2019-07-29 101.9% 97.7% View
-3.66 1.000 1.8100 325.31m -6.75m 3 2019-02-28 31 May, 2019 2019-04-26 3331.1% 242.5% View
0.11 0.000 1.8600 434.36m 209.00k 2 2018-11-30 31 May, 2019 2019-01-24 93.2% 97% View
1.64 0.000 1.8600 420.40m 3.08m 1 2018-08-31 31 May, 2019 2018-10-25 45.9% 87.2% View
3.03 2.000 1.8400 424.59m 5.70m 4 2018-05-31 31 May, 2018 2018-07-26 20.1% 15.8% View
2.51 0.000 1.8000 344.78m 4.74m 3 2018-02-28 31 May, 2018 2018-04-30 32.4% 32.7% View
3.66 0.000 1.8200 363.36m 7.01m 2 2017-11-30 31 May, 2018 2018-01-26 326% 14.9% View
0.86 0.000 1.8100 313.64m 1.65m 1 2017-08-31 31 May, 2018 2017-10-26 75.7% 250.2% View
3.52 2.000 1.8000 380.05m 6.76m 4 2017-05-31 31 May, 2017 2017-07-27 4% 4.3% View
3.67 0.000 1.8000 369.70m 7.05m 3 2017-02-28 31 May, 2017 2017-04-26 15.4% 793.2% View
3.18 0.000 1.7800 314.35m 6.11m 2 2016-11-30 31 May, 2017 2017-01-25 1198.9% 181.5% View
0.24 0.000 1.6800 273.16m 470.00k 1 2016-08-31 31 May, 2017 2016-10-26 92.8% 72.5% View
3.37 2.000 1.6800 291.02m 6.49m 4 2016-05-31 31 May, 2016 2016-07-29 721.9% 189.3% View
0.41 0.000 1.6700 256.36m 789.00k 3 2016-02-29 31 May, 2016 2016-04-27 63.6% 224.4% View
1.13 0.000 1.6800 327.26m 2.17m 2 2015-11-30 31 May, 2016 2016-01-29 26.8% 24% View
0.89 0.000 1.6500 322.82m 1.71m 1 2015-08-31 31 May, 2016 2015-10-28 23.7% 41.5% View
1.16 2.000 1.5600 323.79m 2.24m 4 2015-05-31 31 May, 2015 2015-07-30 453.6% 341.3% View
-0.33 0.000 1.5500 270.60m -634.00k 3 2015-02-28 31 May, 2015 2015-04-30 122.2% 121.6% View
1.48 0.000 1.5500 319.17m 2.85m 2 2014-11-30 31 May, 2015 2015-01-30 2.5% 21.2% View
1.52 0.000 1.5000 358.83m 2.93m 1 2014-08-31 31 May, 2015 2014-10-23 414.9% 25.3% View
-0.48 3.000 1.5000 376.77m -929.00k 4 2014-05-31 31 May, 2014 2014-07-25 131.7% 149.7% View
1.52 0.000 1.5100 325.70m 2.93m 3 2014-02-28 31 May, 2014 2014-04-30 19% 89.8% View
1.88 0.000 1.5000 446.60m 3.62m 2 2013-11-30 31 May, 2014 2014-01-27 55.1% 68.3% View
1.21 0.000 1.5100 416.95m 2.33m 1 2013-08-31 31 May, 2014 2013-10-29 24.9% 6.6% View
0.97 2.000 1.4700 441.45m 1.87m 4 2013-05-31 31 May, 2013 2013-07-31 21% 56.4% View
0.80 0.000 1.4700 401.47m 1.55m 3 2013-02-28 31 May, 2013 2013-04-30 28.2% 1107% View
1.11 0.000 1.4600 444.01m 2.15m 2 2012-11-30 31 May, 2013 2013-01-30 1.7% 45.7% View
1.13 0.000 1.4700 441.70m 2.19m 1 2012-08-31 31 May, 2013 2012-10-29 48.9% 60.2% -
2.21 2.000 1.4700 434.71m 4.29m 4 2012-05-31 31 May, 2012 2012-07-31 3248.4% 41.1% -
0.07 0.000 1.4100 344.53m 128.00k 3 2012-02-29 31 May, 2012 2012-04-24 96.8% 96.4% -
2.04 0.000 1.4400 380.67m 3.96m 2 2011-11-30 31 May, 2012 2012-01-20 27.9% 18.7% -
2.83 0.000 1.4000 328.34m 5.50m 1 2011-08-31 31 May, 2012 2011-10-25 24.5% 318.1% -
3.75 2.850 1.3900 392.01m 7.28m 4 2011-05-31 31 May, 2011 2011-07-27 105.2% 54.5% -
1.85 0.000 1.3600 295.38m 3.55m 3 2011-02-28 31 May, 2011 2011-05-11 27.2% 59.9% -
2.59 0.000 1.4000 254.43m 4.88m 2 2010-11-30 31 May, 2011 2011-01-25 293.5% 47% -
-1.34 0.000 1.3700 284.93m -2.52m 1 2010-08-31 31 May, 2011 2010-10-26 153.5% 120.4% -
2.50 0.000 1.4100 296.70m 4.71m 4 2010-05-31 31 May, 2010 2010-07-30 46.8% 64.1% -
4.74 0.000 1.4000 295.53m 8.85m 3 2010-02-28 31 May, 2010 2010-04-27 3.8% 437.4% -
4.97 0.000 1.3800 297.83m 9.20m 2 2009-11-30 31 May, 2010 2010-01-26 25.5% 169% -
6.66 0.000 1.3500 332.03m 12.35m 1 2009-08-31 31 May, 2010 2009-10-27 5.8% 29.6% -
7.07 0.000 1.2700 250.14m 13.11m 4 2009-05-31 31 May, 2009 2009-07-31 599.8% 22.9% View
-1.45 0.000 1.2200 217.83m -2.62m 3 2009-02-28 31 May, 2009 2009-04-30 80.3% 163.5% View
-7.55 0.000 1.3200 337.76m -13.34m 2 2008-11-30 31 May, 2009 2009-01-22 176% 172.7% View
9.94 0.000 1.3600 560.31m 17.55m 1 2008-08-31 31 May, 2009 2008-10-29 3.2% 111.7% View
9.42 4.500 1.2300 456.69m 17.00m 4 2008-05-31 31 May, 2008 2008-07-31 311.8% 145.2% View
2.17 0.000 1.1500 375.22m 4.13m 3 2008-02-29 31 May, 2008 2008-04-29 77.5% 37% View
9.44 0.000 1.1600 476.47m 18.34m 2 2007-11-30 31 May, 2008 2008-01-29 121.2% 10.8% View
4.27 0.000 1.0900 433.68m 8.29m 1 2007-08-31 31 May, 2008 2007-10-30 19.6% 59.4% View
3.57 2.500 1.0700 492.07m 6.94m 4 2007-05-31 31 May, 2007 2007-07-31 5.9% 229.7% View
3.37 0.000 1.0400 391.02m 6.55m 3 2007-02-28 31 May, 2007 2007-04-30 68.1% 26.1% View
11.63 3.000 1.0200 428.60m 20.57m 2 2006-11-30 31 May, 2007 2007-01-23 295.3% 454.7% View
2.95 0.000 0.9600 191.00m 5.20m 1 2006-08-31 31 May, 2007 2006-10-30 147.3% 46.6% View
1.19 4.000 0.9300 178.40m 2.10m 4 2006-05-31 31 May, 2006 2006-07-28 76.3% 66.7% View
5.02 0.000 0.9200 147.42m 8.87m 3 2006-02-28 31 May, 2006 2006-04-14 139.2% 1321.6% View
2.10 0.000 0.8900 166.93m 3.71m 2 2005-11-30 31 May, 2006 2006-01-26 4.5% 5.8% View
2.01 0.000 0.6900 177.55m 3.55m 1 2005-08-31 31 May, 2006 2005-10-28 43.9% 37.8% View
3.58 0.000 0.6700 192.21m 6.32m 4 2005-05-31 31 May, 2005 2005-07-28 913% 146.3% View
0.35 0.000 0.6500 147.78m 624.00k 3 2005-02-28 31 May, 2005 2005-04-29 84.2% 87.1% View
2.23 1.200 0.6500 147.26m 3.94m 2 2004-11-30 31 May, 2005 2005-01-31 52.9% 692.4% View
1.34 0.000 0.6200 138.25m 2.58m 1 2004-08-31 31 May, 2005 2004-10-28 118.9% 25.7% View
-6.09 0.000 0.8100 134.83m -13.66m 4 2004-05-31 31 May, 2004 2004-07-29 382.4% 349.6% View
2.15 0.000 0.7500 77.21m 4.84m 3 2004-02-29 31 May, 2004 2004-04-29 873.2% 33.7% View
0.22 0.000 0.7400 85.95m 497.00k 2 2003-11-30 31 May, 2004 2004-01-28 85.7% 68.2% View
1.54 0.000 0.7600 97.21m 3.47m 1 2003-08-31 31 May, 2004 2003-10-29 36.7% 42.8% View
2.44 2.000 0.7400 109.73m 5.47m 4 2003-05-31 31 May, 2003 2003-07-30 25% 76.3% View
3.25 2.000 0.7400 94.36m 7.29m 3 2003-02-28 31 May, 2003 2003-04-30 366.9% 29.4% View
0.70 0.000 0.7200 83.52m 1.56m 2 2002-11-30 31 May, 2003 2003-01-29 35.7% 102% View
1.08 1.000 0.7061 98.73m 2.43m 1 2002-08-31 31 May, 2003 2002-10-31 0% 319.3% View


NYLEX / 4944 


EPS DPS NTA Revenue P/L Quarter Q Date Financial Year Announced QoQ% YoY% Report
6.36 0.000 1.7400 353.31m 11.40m 4 2021-05-31 31 May, 2021 2021-07-29 130.7% 161% View
2.76 0.000 1.6700 289.06m 4.94m 3 2021-02-28 31 May, 2021 2021-04-28 10.1% 234.5% View
 
ANALYSIS ON QUARTER REPORTS
Financial Quarter Announced    Profit RM ( in million )           EPS
(i) 30 July 2021                           11.40                                    6.36 
(i) 28 April 2021                            4.94                                    2.76
==================================================
                                                                                                9.12
 
Taking on 9.12  x 2 quarters  = 18.24 x PER 10 
                                              =  RM 1.82 - minus 30 % ( for safety margin )
                  Intrinsic value    =  RM 1.27


 =============================================================
See_Research 
 
Short term - Target Price RM 1.20 to RM 1.30 


SEE RESEARCH TARGET PRICES

FOR NYLEX: 

RM 1.20 to RM 1.30 short term

RM 1.50 mid term


===============================================================


ANCOM (4758) S

ANCOM BERHAD Summary

1.450 

-0.040 (-2.68%)


Main Market : Chemicals
High 1.490
Low 1.430
Volume 595,000
Volume (B/S) 1,500 / 5,600
Price Bid/Ask 1.450 / 1.460
   
52w 0.688 - 1.840
ROE 6.28
P/E 15
EPS 9.36
DPS  
DY 0.00%
   
NTA 1.4900
P/B 0.97
RPS 601.06
PSR 0
Market Cap 371.1M
Shares (mil) 255.96
TopQ QoQ ConQ YoY RTopQ RQoQ RConQ RYoY
RSI(14) Neutral 36.4
Stochastic(14) Neutral 25.0
Average Volume 744,000
Relative Volume 0.8


======================================================================================================================================
ANCOM/ 4758
Journey to 1 ,000,000,000.00 / 1 billion  RINGGIT MALAYSIAN -- market capitalisation

50 million  PATAMI,( profit after tax and minority interests ) 20x P/E
1Billion- RM ,  market cap

[ 20x P/E is very conservative ; as Hextar/Global Berhad /5151--  (is assigned a 30x P/E by Public Bank-  Research )

DETAILS SHOWING THE CALCULATIONS 
40m PAT from Agrochemical business 
20m PAT from Industrial & Petrochemical business
minus (10m) Corporate costs
= 50m PAT

(i)  Current Ancom share base = 250m
(ii)  ESOS = 20m
(iii) Issuance to Nylex minority = 30m
(iv)Total Ancom shares (post consolidation exercise )
= 300m

1B market cap/300m shares =
=====================================================================


ANCOM (4758) S

ANCOM BERHAD Summary

1.450 

-0.040 (-2.68%)

Main Market : Chemicals
High 1.490
Low 1.430
Volume 595,000
Volume (B/S) 1,500 / 5,600
Price Bid/Ask 1.450 / 1.460
   
52w 0.688 - 1.840
ROE 6.28
P/E 15
EPS 9.36
DPS  
DY 0.00%
   
NTA 1.4900
P/B 0.97
RPS 601.06
PSR 0
Market Cap 371.1M
Shares (mil) 255.96
TopQ QoQ ConQ YoY RTopQ RQoQ RConQ RYoY
RSI(14) Neutral 36.4
Stochastic(14) Neutral 25.0
Average Volume 744,000
Relative Volume 0.8


EPS DPS NTA Revenue P/L Quarter Q Date Financial Year Announced QoQ% YoY% Report
3.19 0.000 1.4900 445.89m 7.61m 4 2021-05-31 31 May, 2021 2021-07-29 7.4% 164.5% View
2.98 0.000 1.4600 389.20m 7.08m 3 2021-02-28 31 May, 2021 2021-04-28 14.4% 4193.3% View
2.59 0.000 1.4300 357.27m 6.19m 2 2020-11-30 31 May, 2021 2021-01-26 102.3% 393.6% View
1.28 0.000 1.4000 346.12m 3.06m 1 2020-08-31 31 May, 2021
ANALYSIS ON QUARTER REPORTS
Financial Quarter Announced    Profit RM ( in million )           EPS
(i) 29July 2021                               7.61                                   3.19
(i) 28 April 2021                             7.08                                   2.98
(i) 26 Jan  2021                             6.19                                   2.59
(i) 27 Oct  2020                             3.06                                   1.28
=============================================================
                                                     23.94 millions                   10.04
analysis based on PER 30 x 10.04 = RM 3.00
 
intrinsic value = RM 3.00
 
What is a fair P/E for ANCOM?
Local agrochemical Hextar /5151 is given a P/E of 30 by PublicInvest.
What about other listed agrochem companies?

In the world of agrochemical companies that are listed
- Bayer Crop Science [P/E 52]
- Corteva                    [P/E 49]
- Sumitomo                [P/E 59]
- Adama                     [P/E 59]

Average of P/E 50+ !!
Because they deal with FOOD SECURITY via crop protection, just like ANCOM.

Taking CURRENT FY patami of RM24m at various levels of P/E, 
what would the market cap of ANCOM be from current level of RM 371m?
( as at 30 July 2021 ) 

P/E 25 = RM642m [ 73% upside ]
P/E 30 = RM767m [ 106% upside ]
P/E 35 = RM895m [ 141% upside ]

ANCOM's turnaround story has just begun, so the P/E may be gradually moving up. Plus, management forecast next year's results to be better than the current year's RM24 millions 
==================================================
                                                                                                
 
SEE RESEARCH
ANCOM / 4758
TARGET PRICES
RM 2.00 per share- short term
RM 2.50 per share- mid term 


ANCOM transforms into one of the LARGEST and PROFITABLE flagship integrated chemical group in Malaysia
(CCM 2.0?)
With this corporate consolidation exercise,
ANCOM is another step closer in realising its BILLION RINGGIT market cap target.

Finally...

NYLEX,

  ANCOM,  
will be  a TWIN GEMS in the near future 
 

 =======================================================================================================================================

 Remarks:
Sole agent exclusively by Ancom Berhad for sanitizer with ethanol ( ethanol is the main ingredient )

Manufacturer of ethanol is FERMPRO wholly owned subsidiary of NYLEX.

The above picture showing the full client list of Entopest Environmental Services Sdn Bhd / subsidiary of Ancom Bhd 

(official qualified licensed fumigator, a legal recognition awarded by the Malaysian - Ministry of Agriculture Awards the license upon the completion of intensive course on all aspects of fumigation requirements by the Ministry of Health.

Credentials - wide spectrum of clients (Tier One Clients) from:

i. Hypermarkets - Tesco, AEON, MYDIN, Giant.

ii. Banks - Maybank.

iii. Universities - Taylor's University, UPM, Garden International School.

iv. Corporate offices - Amway, Goodyear, KLK Oleo, Gamuda, Sunway, Gas Malaysia.

v. Hotels - Le Meriden, Renaissance Hotel, Grand Hyatt, The Mines Hotel.

vi. Restaurant Chains - Texas Chicken, Old Town, Secret Recipe.

vii. Logistics/Warehouses - TASCO/NYK Nippon Yusen Kaisha Group, Sanyku Group Japan.

viii. Medical & Healthcare - Ministry of Health Malaysia, Gleneagles Hospital, Caring, Guardian. 

 The above picture shows

 Entopest is offering full sanitizing services that are compliant to the US FDA regulations for industrial and commercial usage that are highly effective against 

Corona viruses.


The above picture shows a snapshot from one of Petronas stations in Malaysia.

 In fact, all Petronas station toilets have

 Entopest Hygiene sanitizing facilities.

 In short, it caters for all segments of market - from domestic to commercial uses.


The Specific Answer: ANCOM/4758 & NYLEX/4944

New NYLEX Investors 
NEW ANCOM Investors 
will mimic the raging bull as the prices can  soar ,
and can soar - for a positive price rally .
from 2  August  2021 onwards.


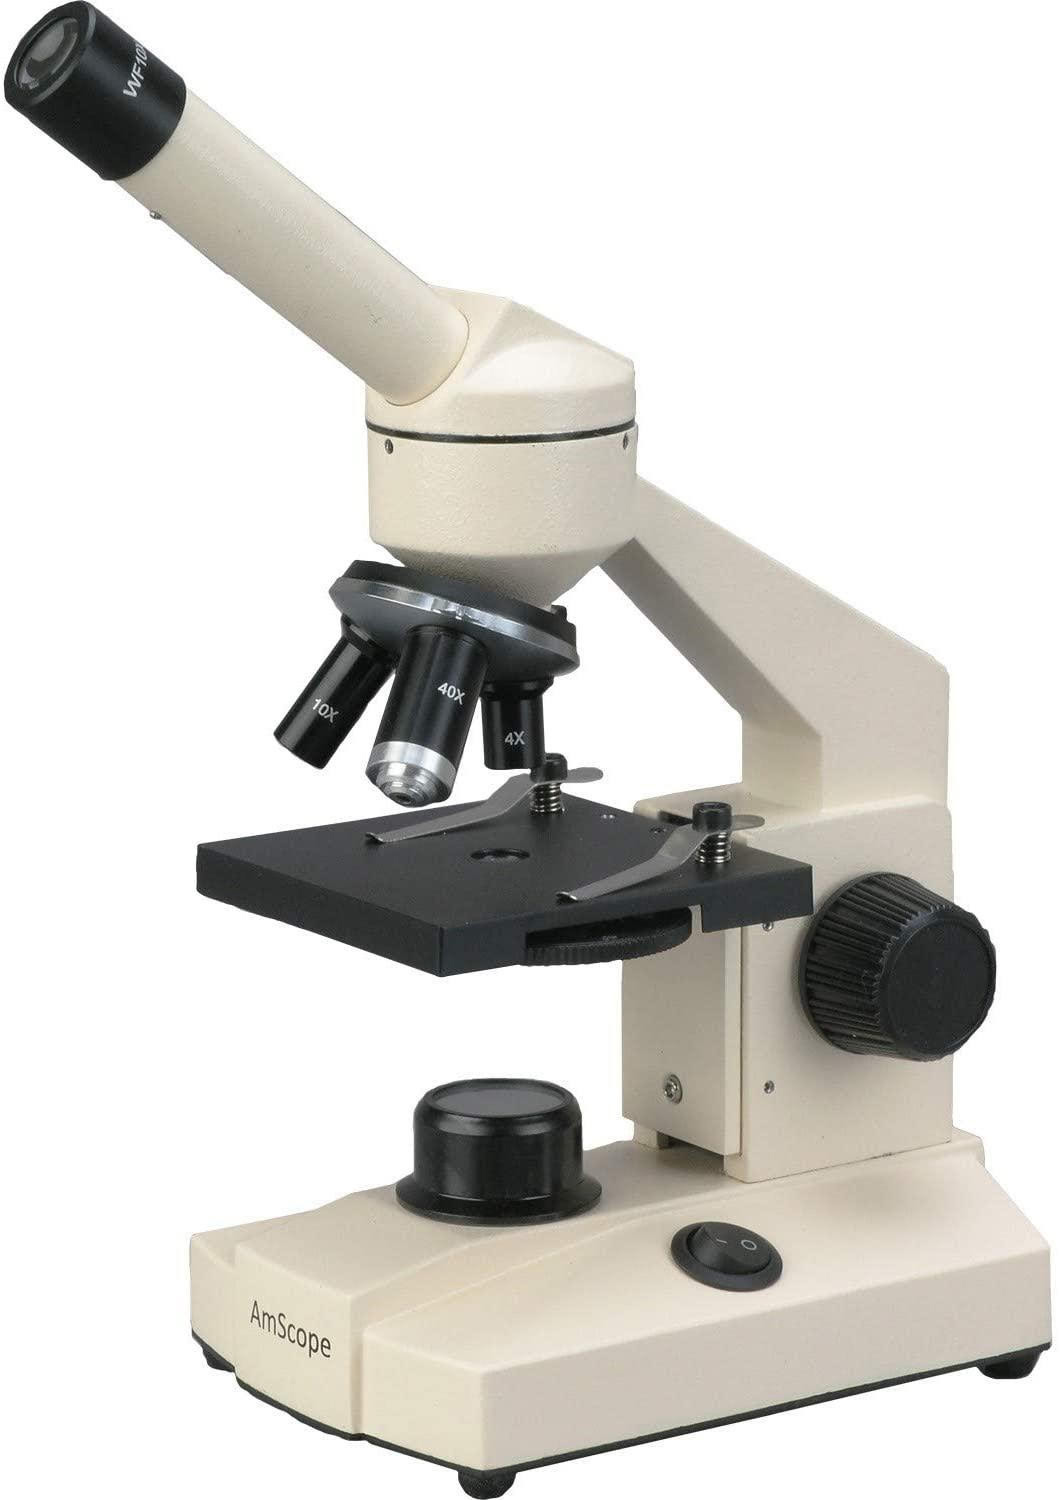
You would not need to use the above 2 equipments as we have done research for you.
 

SUMMARY

SEE RESEARCH

  FOR NYLEX :   

TARGET PRICES


RM 1.20 short term,

RM 1.50 mid term

 ===================================================

FOR ANCOM: 

TARGET PRICES

RM 2.00 short term,

RM 2.50 mid term

 -------------------------------------------------------------------------------------------------------------------------------------------------------------------------------------------------------------------------------------------

Key Abbreviations:

1. Ancom Berhad - is the holding company of Nylex (Malaysia). Berhad and Ancom Logistics Berhad, both are listed on the Bursa Malaysia Securities Berhad Main Board and ACE Market respectively.

2. Entopest Environmental Services Sdn Bhd (wholly-owned subsidiary of Ancom Berhad).

3. Fermpro Sdn Bhd (subsidiary of Nylex Berhad) Nylex Malaysia Berhad.

---------------------------------------------------------------------------------------------------------------------------------------------------------------------------------------------------------------------------------------------


Thanks for reading and see you in the next post. 


DISCLAIMER:IT IS NOT A BUY OR SELL CALL AND IS ONLY A PERSONAL OPINION, WRITTEN AS ARTICLE FOR SHARING PURPOSES TO KLSE COMMUNITY MEMBERS.

Investment involves risks, including possible loss of investment and other losses. 

 This article and charts are provided for information only and should not be construed as a solicitation to buy or sell any of the instruments mentioned herein. 

The author may have positions in some of these instruments. The author shall not be responsible for any losses or profits resulting from investment decisions based on the use of the information contained herein. If investments and other professional advice is required, the services of a licensed professional person should be sought.


 ISSUED BY SEE RESEARCH 

(SENSING EAGLE EYES RESEARCH


More articles on SEE_Research
Discussions
Be the first to like this. Showing 0 of 0 comments

Post a Comment