Jati Tinggi Group - Consolidation Triangle Has Ended?
sectoranalyst
Publish date: Fri, 01 Mar 2024, 10:21 AM

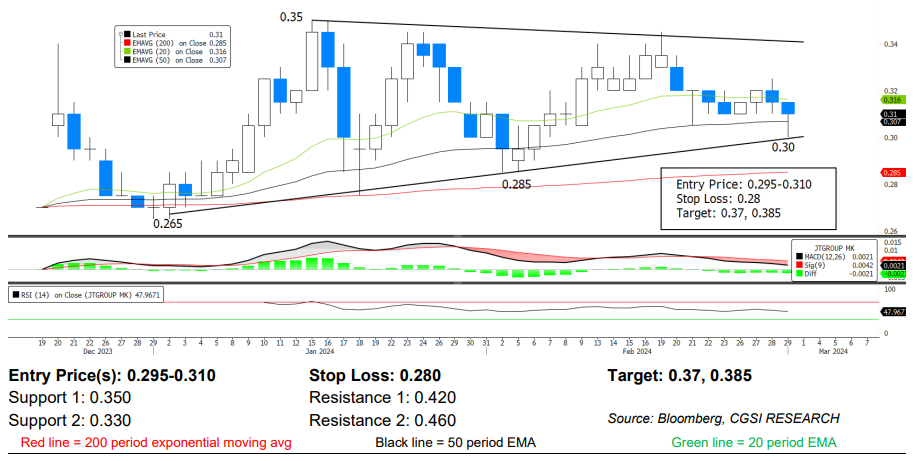
Since inception, the stock has been trading in a tight range. As time goes by, the formation is getting clearer now, and we can see a triangle pattern that is taking form. With the formation of a hammer candle above its 50-day EMA yesterday, the stock may be at the end of its triangle pattern. Once this triangle ends, we expect prices to breakout to new highs next.
The Moving Average Convergence Divergence (MACD) and the Relative Strength Index (RSI) are sitting just above their respective neutral levels. Both indicators suggests that the bulls have the upper hand right now.
We think that aggressive traders may want to go long here or on weakness with a stop-loss set at RM0.28 (a tick below the last swing low). On the upside, prices may start to climb here. Look for a breakout of this triangle pattern in the weeks ahead, targeting the Fibonacci levels at RM0.37 (1.382) and RM0.385 (1.618).
Source: CGS-CIMB Research - 1 Mar 2024
Related Stocks
| Chart | Stock Name | Last | Change | Volume |
|---|
Market Buzz
More articles on CGS-CIMB Research
Created by sectoranalyst | Jan 13, 2025
Created by sectoranalyst | Dec 11, 2024
Created by sectoranalyst | Sep 27, 2024


