


Chart Pattern Traders
Kobay: It is in critical level now !!! do or die and breakaway from triangle,

Chart_Pattern_Trader
Publish date: Wed, 30 Dec 2015, 10:30 PM
I am using chart pattern to identify trading opportunity, I don't take FA as a consideration, it carry certain high probability will make profit base on the chart pattern. pls do own study regard FA point of view.
if you want to trade this stock, pls take it on your own risk.
if you want to trade this stock, pls take it on your own risk.
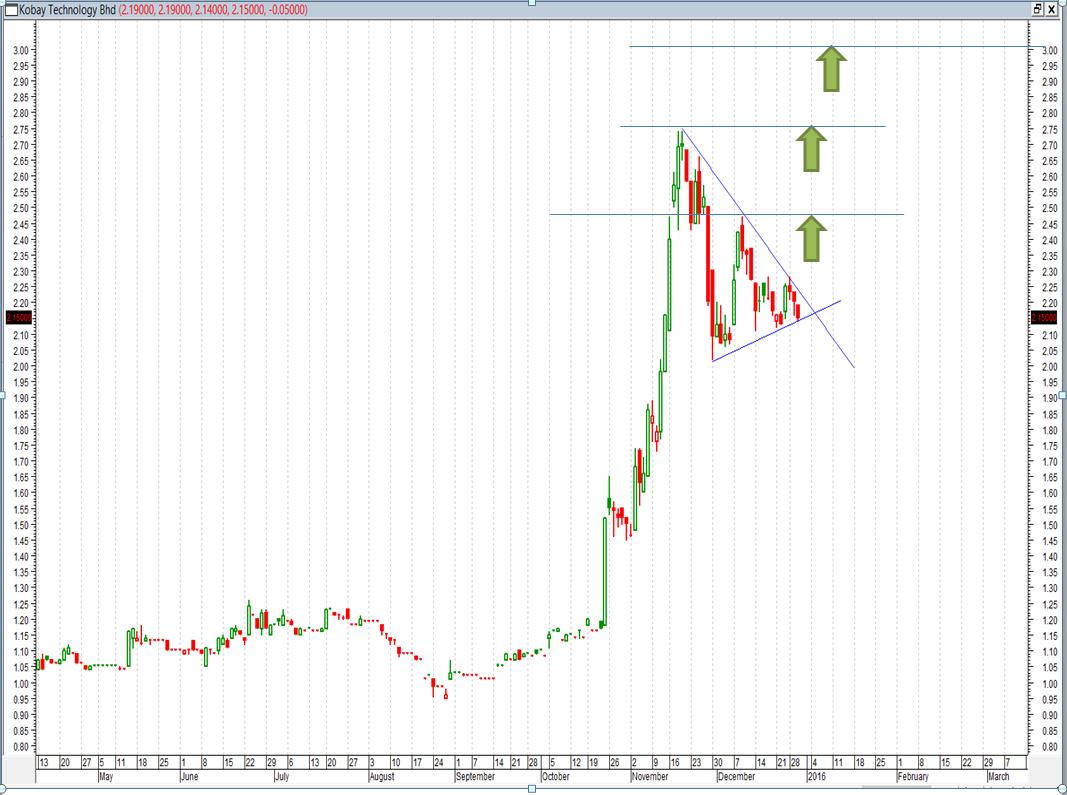
Looking at the kobay chart pattern, it is forming triangle chart patern, most likely breakout is just around the corner, it is either breakout or breakdown.
1.) breakdown from the triange support line will bring this stock to test next level support of $2.11/$2.02 and possibe of $1.74 after $2.00 break, if it happen, this stock may need to go through longer correction.
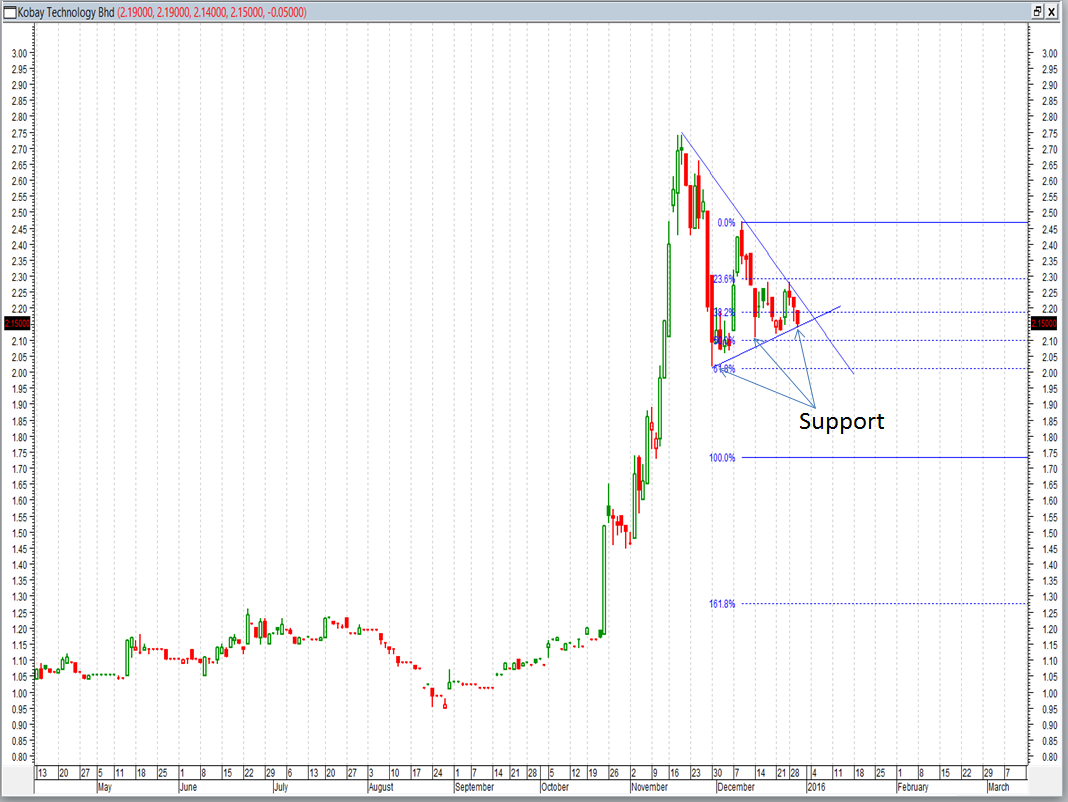
2.) Break out(up) away from resistance line of $2.28! , this stock will carry very bullish implication, mostlikely wil test $2.47 and possible to break $2.74 and headinf to $3.00
Discussions
Be the first to like this. Showing 1 of 1 comments
Post a Comment
Featured Posts


Latest Videos


.png)


Apps


Top Articles
1
https://dividendguy67.blogspot.com
2
Stock Pick Contest Year 2024
3
BFM Podcast
4
5
Stock Market Enthusiast
CIMB: Uptrend Continues - Is the Best Yet to Come? (Uptrend + Bullish) - KingKKK
6
BFM Podcast
7
Koon Yew Yin's Blog
8
https://dividendguy67.blogspot.com
#
Stock
Score
Daily Stocks
Stock Name
Last
Change
Volume
Stock Name
Last
Change
Volume
Stock Name
Last
Change
Volume
MQ Trading Signals
Stock
Time
Signal
Duration
No trading signals available.
Stock
Time
Signal
Duration
No trading signals available.
Featured Advertisers / Partners


Ride The Bull Short The Bear
CS Tan
4.9 / 5.0
This book is the result of the author's many years of experience and observation throughout his 26 years in the stockbroking industry. It was written for general public to learn to invest based on facts and not on fantasies or hearsay....
hkkoay2288
More likely to breakdown ..
2015-12-31 00:29