


HLBank Research Highlights
Traders Brief - Cautiously Optimistic on FBM KLCI

MARKET REVIEW
Asia’s stock market closed mixed, tracking the negative overnight Wall Street performance as traders and investors were undecided after the trade discussions between US and China officials ended without major developments. The Nikkei 225 and Shanghai Composite Index rose 0.85% and 0.18%, respectively, while Hang Seng Index dropped 0.43%.
Meanwhile, stocks on the local front reversed the buying momentum as profit taking emerged after sentiment was dampened further by Sapura Energy’s rights issue announcement. The FBM KLCI slipped 0.13%. Market breadth was negative with 638 decliners vs 267 advancers. Nevertheless, selected export-related counter such as Wegmans, Frontken and Hartalega traded higher.
Wall Street trended fairly bullish led by technology sector and S&P500 and Nasdaq ended in the all-time-high zone lifted by Netflix. Also, the Fed’s Chairman Jerome Powell commented that the US economy is “strong” and would maintain the interest rate up-cycle moving forward. The Dow added 0.52%, while S&P500 and Nasdaq climbed 0.62% and 0.86%, respectively.
TECHNICAL OUTLOOK: KLCI
Despite a softer closing last Friday, the FBM KLCI trended positively on the weekly basis, forming a bullish candle. The weekly MACD indicator continues to recover after forming a “buy” signal. Should there be any committed breakout above 1,810; next target will be located around 1,830, while the support will be located around 1,800, follows by 1,790.
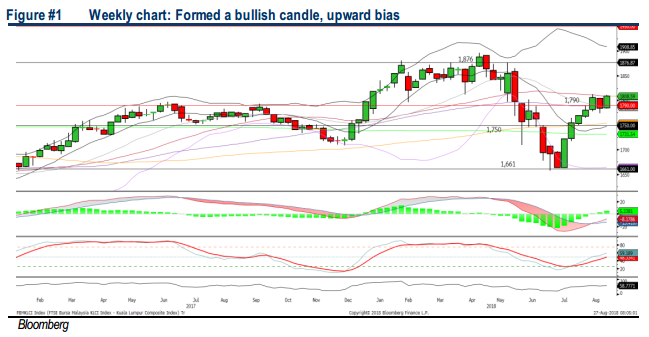
As we approached the peak of the August reporting season, we believe traders will trade on a cautious manner. The FBM KLCI may trend sideways between the range of 1,790-1,810 over the near term. Meanwhile, we still see opportunities within the export-related and selected O&G stocks on the back of weaker ringgit prospects and firmer crude oil prices, respectively.
TECHNICAL OUTLOOK: DOW JONES
The Dow snapped a 4-day losing streak and formed a flag pattern breakout. The MACD indicator is trending higher. However, the momentum oscillators are suggesting mixed signals; RSI is above 50, but Stochastic oscillator is overbought. Hence, we believe the Dow could trend sideways before another rebound to revisit 26,000. Support will be pegged around 25,500, followed by 25,000.
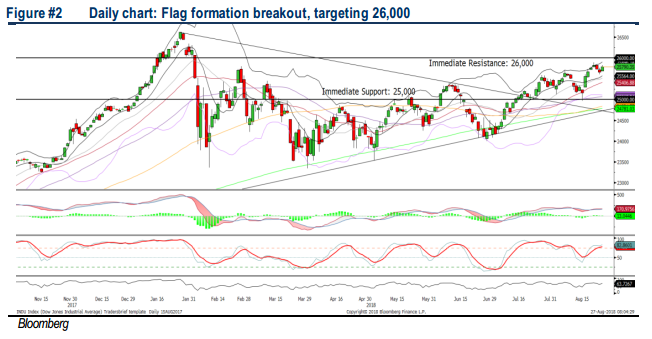
On Wall Street, as the mid-level trade talks concluded without any fresh developments, it could generate short term positive trade flows in the market. However, on trade fronts, the next watch out period will be the public hearing in September for the proposed list worth USD200bn on Chinese goods.
Source: Hong Leong Investment Bank Research - 27 Aug 2018
More articles on HLBank Research Highlights
Discussions
Be the first to like this. Showing 0 of 0 comments
Post a Comment
Featured Posts
Introducing MY's First IPO Fund for Sophisticated Investors!
New Update. Discover investment communities that resonate with your ideas
M & A Value Partners IPO Equity Fund has been launched - Targeted 13% Return p.a
Latest Videos


Apps


Top Articles
1
2
3
BFM Podcast
4
BFM Podcast
6
BFM Podcast
7
8
Mercury Securities Research
#
Stock
Score
Daily Stocks
Stock Name
Last
Change
Volume
Stock Name
Last
Change
Volume
Stock Name
Last
Change
Volume
MQ Trading Signals
Stock
Time
Signal
Duration
Stock
Time
Signal
Duration
Featured Advertisers / Partners


Ride The Bull Short The Bear
CS Tan
4.9 / 5.0
This book is the result of the author's many years of experience and observation throughout his 26 years in the stockbroking industry. It was written for general public to learn to invest based on facts and not on fantasies or hearsay....