


Kenanga Research & Investment
Daily Technical Highlights - (MKH, INARI)

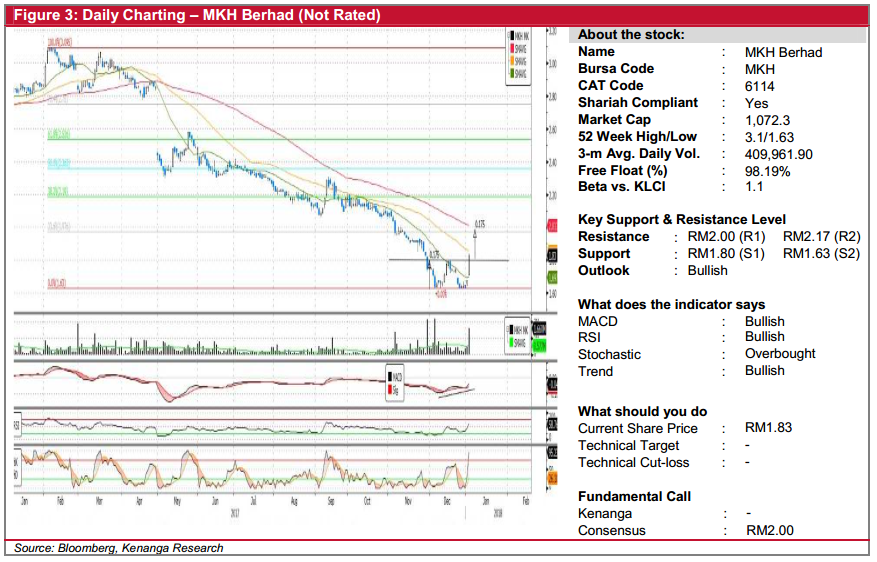
MKH (Not Rated). Yesterday, MKH gained an impressive 15.0 sen (8.9%), to finish at RM1.83. The move was accompanied by strong trading volume, with 1.7m shares traded – triple its 20-days average of 577k. Chart-wise, MKH has been on a downtrend since February 2017, with its share price plunging from RM 3.09 to a low of RM1.63. Notably, yesterday’s bullish move completes a breakout from a "double-bottom" pattern, marking a possible indication of downtrend reversal. Moreover, bullish MACD divergence along with upticks in other key oscillators showed improvement in the technical picture. Hence, based on the reversal pattern measurement objective, we expect MKH to advance towards RM2.00 (R1), and possibly RM2.17 (R2) should R1 is violated. Conversely, near-term dips may be taken as buying opportunities with support levels identified at RM1.80 (S1) and RM1.63 (S2).
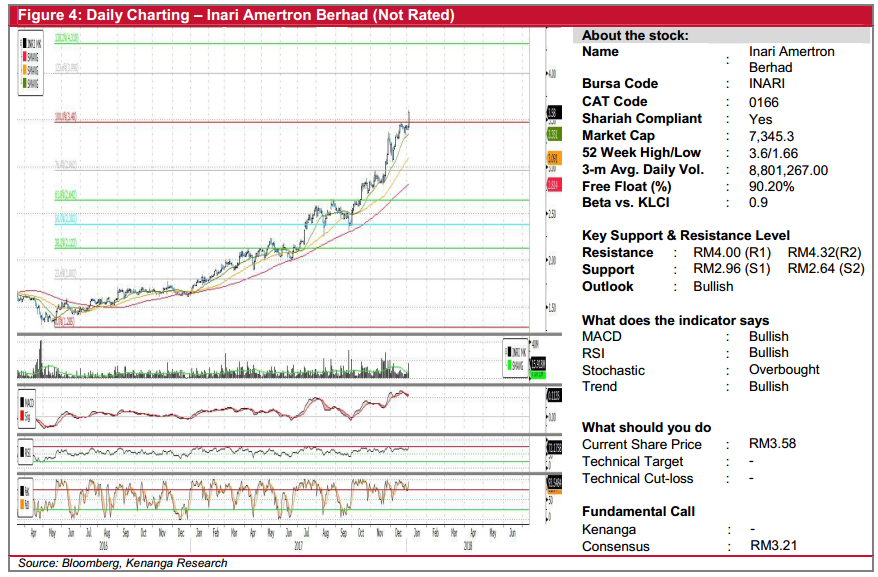
INARI (Not Rated). INARI caught our attention yesterday after it rose 15 sen (4.4%) to finish at a record high of RM3.58. This was accompanied by exceptional trading volume of 15.9m exchanging hands - more than double its 20-day average daily trading volume. We believe yesterday's move may signal a continuation of a prior uptrend since the start of April 2016. Furthermore, yesterday's breakout also took out its previous resistance at RM3.48 with the share price leading key SMAs. The MACD indicator showed a positive uptick and is also healthily above the signal line. With that, we expect follow-through buying momentum towards RM4.00 (R1) with a further hurdle at RM4.32 (R2). Conversely, key support levels can be found at RM2.96 (S1) with a lower support level at RM2.64 (S2).
Source: Kenanga Research - 4 Jan 2018
Related Stocks
| Chart | Stock Name | Last | Change | Volume |
|---|
More articles on Kenanga Research & Investment
Discussions
Be the first to like this. Showing 0 of 0 comments
Post a Comment
Featured Posts


Latest Videos


Apps


Top Articles
1
2
3
Koon Yew Yin's Blog
4
save malaysia!
6
7
THE INVESTMENT APPROACH OF CALVIN TAN
8
CEO Morning Brief
#
Stock
Score
Daily Stocks
Stock Name
Last
Change
Volume
Stock Name
Last
Change
Volume
Stock Name
Last
Change
Volume
Featured Advertisers / Partners


Ride The Bull Short The Bear
CS Tan
4.9 / 5.0
This book is the result of the author's many years of experience and observation throughout his 26 years in the stockbroking industry. It was written for general public to learn to invest based on facts and not on fantasies or hearsay....