


Kenanga Research & Investment
Daily Charting – UOAREIT (Technical Buy)

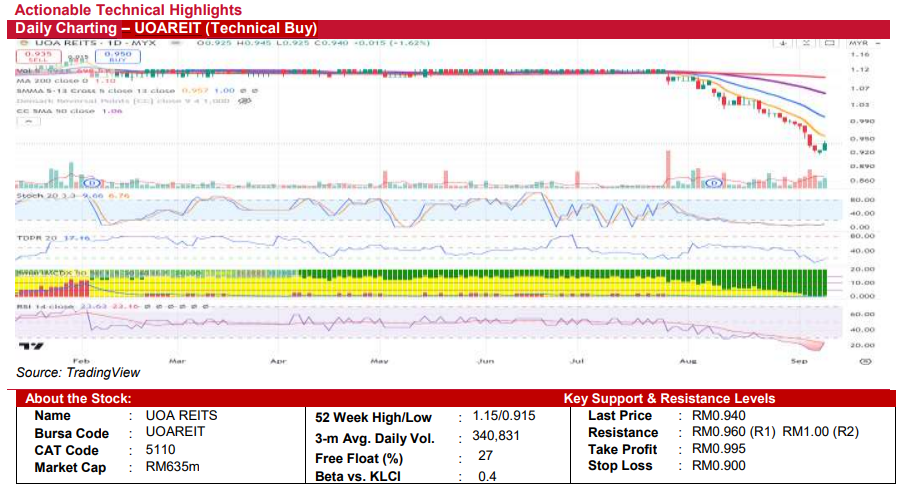
UOAREIT BERHAD (Technical Buy)
• UOA REITs (UOAREIT) closed at RM0.940, up by 1.62%. The stock’s performance has been underpinned by a consolidating price range which hints at an impending directional movement. The recent trading sessions have shown attempts to stabilize above the support levels, with the candlestick patterns suggesting a possible easing of the prior bearish pressure.
• On the technical analysis front, the Stochastic Oscillator is rising from low levels, suggesting a potential increase in momentum. Additionally, the RSI is just below 30, pointing to an oversold condition that may attract buyers looking for a bargain, anticipating a rebound. The stock’s weekly chart also displayed a similar oversold setup.
• Key levels to watch include the immediate resistance at RM0.960 (5-day SMA). A break above this level could see the stock challenge further resistance at RM1.00 (13-day SMA) and RM1.06 (50-day SMA). Support is currently established around RM0.915, with further downside risks potentially extending to lower historical support zones at RM0.88-RM0.90 range, levels not seen since 2008.
• Given the oversold conditions and the stabilizing price actions, considering an entry around RM0.940 might be opportune. A take-profit exit can be reasonably set at RM0.995, with an extended target up to RM1.06 if momentum persists. To manage risks, a stop-loss slightly below the support at RM0.90 would limit exposure, presenting a balanced risk-to-reward scenario for those looking to capitalize on potential short-term gains from UOAREIT’s market movements
Source: Kenanga Research - 10 Sept 2024
Related Stocks
| Chart | Stock Name | Last | Change | Volume |
|---|
More articles on Kenanga Research & Investment
Weekly Technical Highlights – Dow Jones Industrial Average (DJIA)
Created by kiasutrader | Jan 27, 2025
BoJ Monetary Policy Decision (23-24 January) - Hikes rate to 17-year high as wage pressures mount
Created by kiasutrader | Jan 27, 2025
Ringgit Weekly Outlook - To hold steady with downside bias amid US policy uncertainty
Created by kiasutrader | Jan 24, 2025
YTL Power International - 1-for-5 Warrants to Reward Shareholders
Created by kiasutrader | Jan 24, 2025
Discussions
Be the first to like this. Showing 0 of 0 comments
Post a Comment
Featured Posts
Introducing MY's First IPO Fund for Sophisticated Investors!
New Update. Discover investment communities that resonate with your ideas
M & A Value Partners IPO Equity Fund has been launched - Targeted 13% Return p.a
Latest Videos


MQ Trading Signals
Time
Signal
Duration
Type
2025-01-27 14:30:00
EMA 5
10 Mins
SELL
2025-01-27 14:30:00
EMA 5
5 Mins
SELL
2025-01-27 14:30:00
MACD/RSI
5 Mins
SELL
2025-01-27 11:30:00
EMA 5
10 Mins
BUY
2025-01-27 11:20:00
EMA 5
5 Mins
BUY
Apps


Top Articles
1
THE INVESTMENT APPROACH OF CALVIN TAN
AFTER ALL THE ACCUSATIONS & ALLEGATIONS CALVIN TAN WANT TO POST THE TRUTH IN DEFENSE, Calvin Tan
2
THE INVESTMENT APPROACH OF CALVIN TAN
3
M+ Online Research Articles
4
TA Sector Research
5
Kenanga Research & Investment
6
MQ Market Updates
7
RHB Investment Research Reports
8
TA Sector Research
#
Stock
Score
Daily Stocks
Stock Name
Last
Change
Volume
Stock Name
Last
Change
Volume
Stock Name
Last
Change
Volume
Featured Advertisers / Partners


Ride The Bull Short The Bear
CS Tan
4.9 / 5.0
This book is the result of the author's many years of experience and observation throughout his 26 years in the stockbroking industry. It was written for general public to learn to invest based on facts and not on fantasies or hearsay....