MQ Trader – Adjusted Price [CCK, TIGER, TOPGLOV]
MQTrader Jesse
Publish date: Fri, 17 Aug 2018, 06:06 PM
Introduction
In this article, we will proceed to show how does the adjusted price work on removing the effect of corporate actions to the share price by using MQ Trader Stock Analysis System. To read the first part of this topic, kindly visit MQ Trader - Introduction of Adjusted Price.
Adjusted Price for Stock Splits
In the previous blog post – MQ Trader – Introduction of Corporate Actions (Part 1), CCK was used as the example for demonstrating the effect when a stock split takes place.
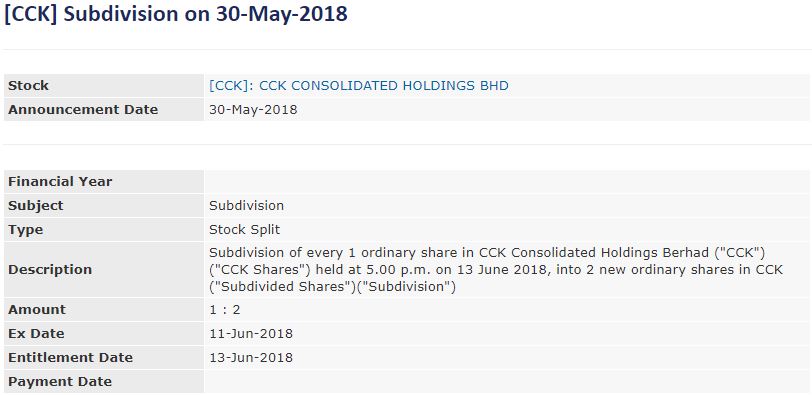
Figure 1: Announcement of the stock splits on 30 May 2018
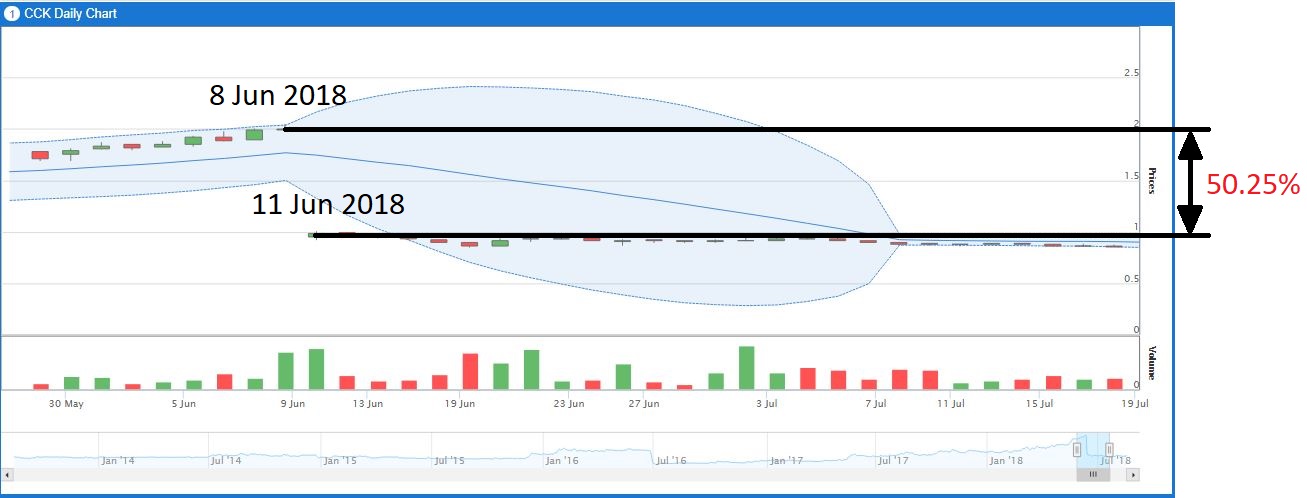
Figure 2: Original price of CCK
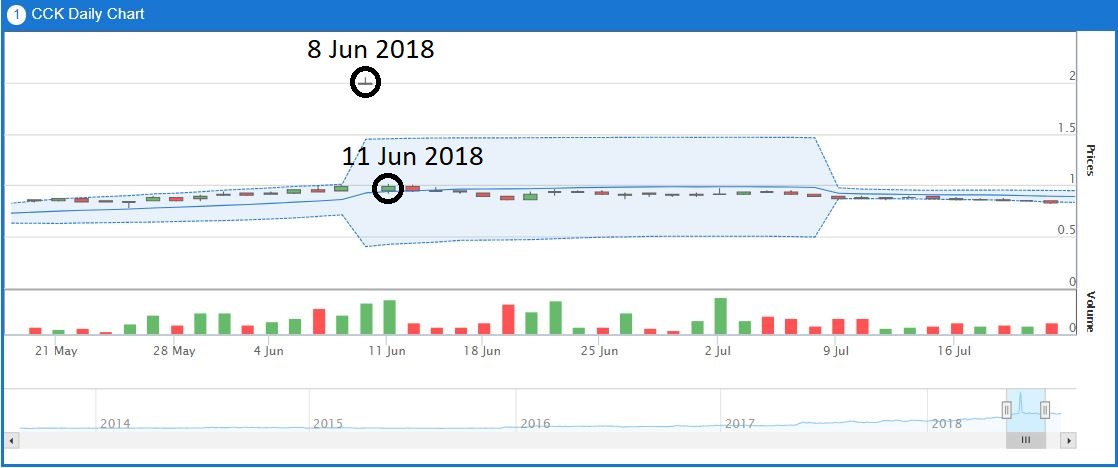
Figure 3: Adjusted price of CCK
Figure 2 indicates that there is a large gap down (50.25% fall in share price) between the share price on 8 Jun 2018 and 11 Jun 2018. After price adjustment has been applied, the share price of CCK remains constant showing that its share value is the same before and after the implementation of the stock split. Hence, panic selling can be avoided, as the adjusted share price is able to filter the false bearish signal caused by the stock split.
Adjusted Price for Consolidation
TIGER was used as the example for demonstrating the effect when a consolidation occurs in MQ Trader – Introduction of Corporate Actions (Part 1). This part is the continuation of the post which explain the impact of price adjustment on its technical chart.
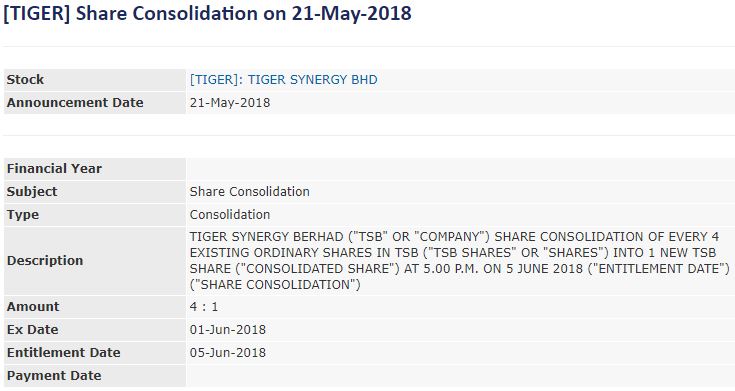
Figure 4: Announcement of the consolidation on 21 May 2018
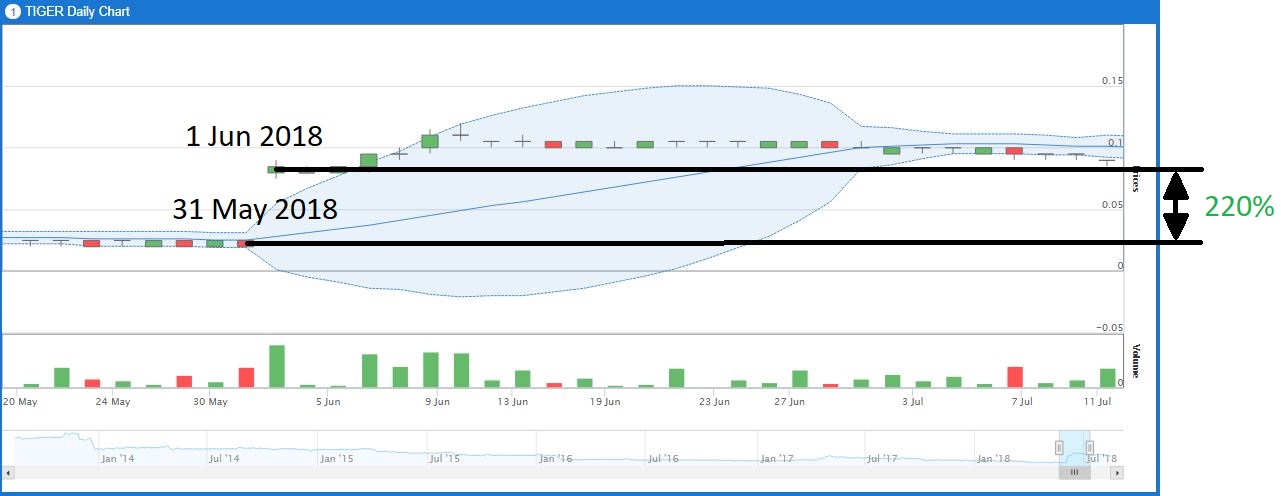
Figure 5: Original price of TIGER
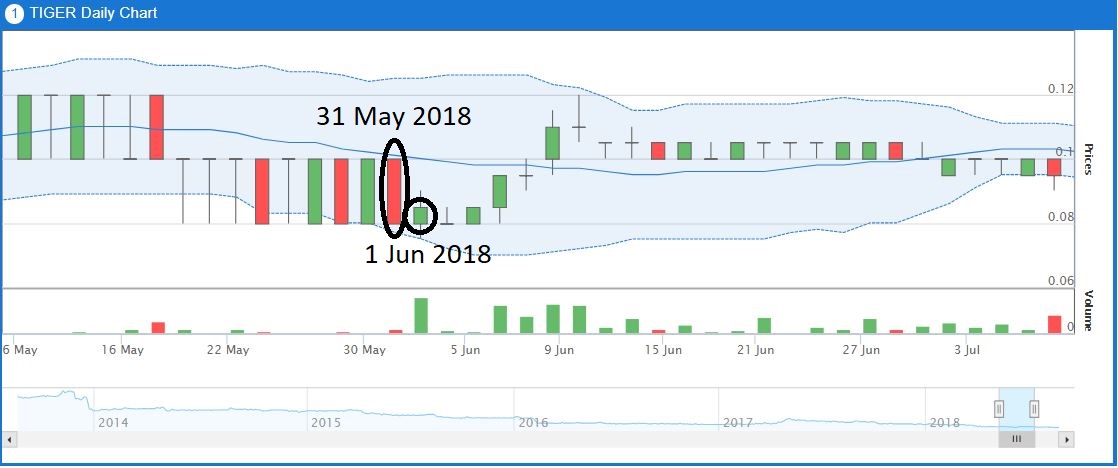
Figure 6: Adjusted price of TIGER
Figure 5 indicates that there is a large gap up (220% rise in share price) between the share price on 31 May 2018 and 1 Jun 2018. After price adjustment has been applied, the share price of TIGER is experiencing sideways trend showing that its share value remains the same before and after the implementation of the consolidation. Hence, oversold position can be avoided, as the adjusted share price is able to eliminate the false bullish signal due to the consolidation.
Adjusted Price for Bonus Issue
TOPGLOV was selected as the example for demonstrating the effect when a bonus issue is declared in MQ Trader – Introduction of Corporate Actions (Part 1). This part is the continuation of the post which explains the effect of price adjustment on its technical chart.
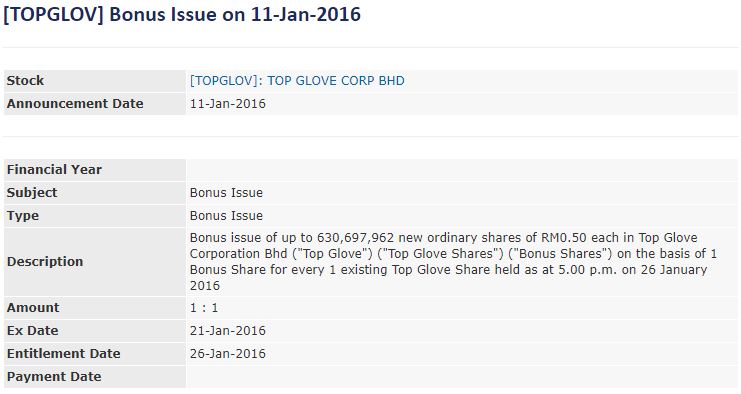
Figure 7: Announcement of the bonus shares on 11 May 2016.
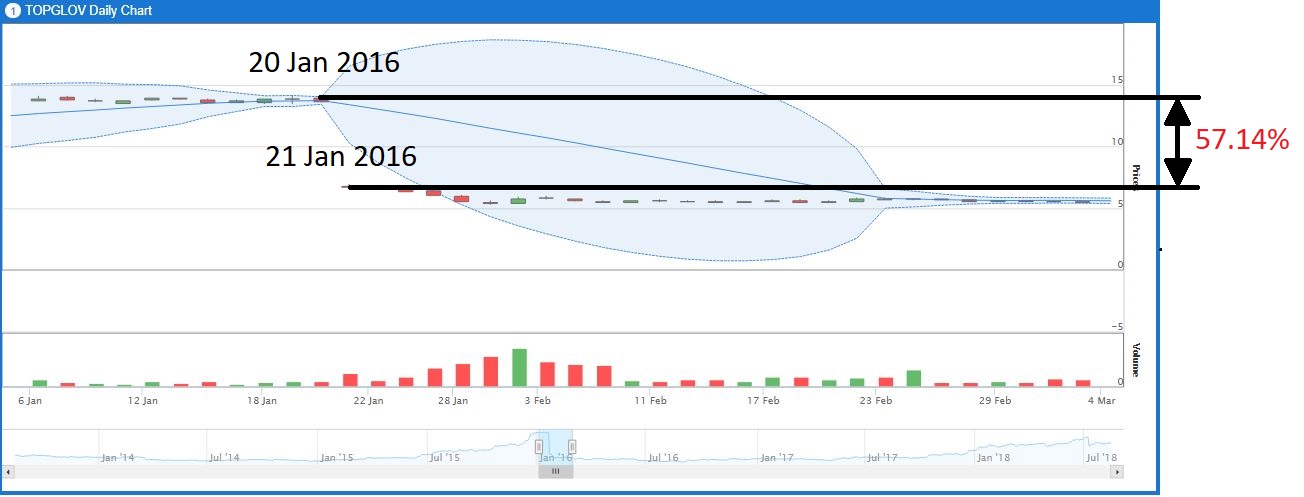
Figure 8: Original price of TOPGLOV
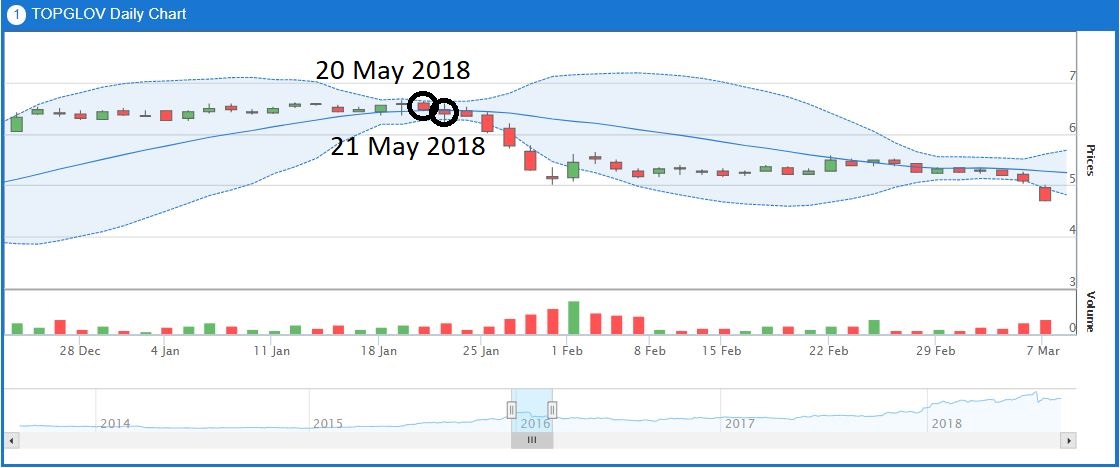
Figure 9: Adjusted price of TOPGLOV
Figure 8 shows that there is a large gap down (57.14% drop in share price) between the share price on 20 May 2016 and 21 May 2016. After price adjustment has been applied, the share price movement of TOPGLOV is smoothened and the existence of bearish trend after 21 May 2016 is purely caused by the strong selling momentum. Thus, misleading signal can be avoided, as the adjusted share price is able to eliminate the false bearish signal contributed by the bonus issue.
Conclusion
Adjusted price of a share is very essential in generating accurate trading signal based on the real price movement in our investment. However, please bear in mind that the adjusted historical price cannot be used as a reference for the actual buy or sell price for a stock at the particular period in the past. Therefore, both adjusted price and original price should be used for comparison, as they play important roles in providing useful information on the performance of a company and market sentiments.
Community Feedback
We encourage traders to try out and evaluate the MQ Trader system and provide us feedback on the features you like to see in the system. We have received many positive feedbacks so far, and we are currently compiling and reviewing them for possible inclusion into the next release of the system.
We would like to develop this system based on community feedback to cater for community needs. Thanks to all those who have provided valuable feedback to us. Keep those feedbacks coming in!
Disclaimer
This article does not represent a BUY or SELL recommendation on the stock covered. Traders and Investors are encouraged to do their own analysis on stocks instead of blindly following any Trading calls raised by various parties in the Internet. We may or may not hold position in the stock covered, or initiate new position in the stock within the next 7 days.
Join us now!
MQ Trader stock analysis system uses Artificial Intelligence (AI), various technical indicators and quantitative data to generate accurate trading signals without the interference of human's emotions and bias against any particular stock. It comprises trading strategies which are very popular among fund managers for analysing stocks.
MQ Trader stock analysis system is SPONSORED for MQ Trader members. To use this amazing tool, you can sign up via MQ Trader Sign Up!
Contact us
Please do not hesitate to contact us if you have any enquiry:
Related Stocks
| Chart | Stock Name | Last | Change | Volume |
|---|
Market Buzz
2024-11-17
TOPGLOV2024-11-16
TWL2024-11-14
TOPGLOV2024-11-14
TWL2024-11-13
TOPGLOV2024-11-11
TOPGLOV2024-11-11
TOPGLOV2024-11-08
TOPGLOV2024-11-08
TOPGLOV2024-11-08
TWL2024-11-07
TOPGLOV2024-11-07
TOPGLOV2024-11-07
TOPGLOV2024-11-07
TOPGLOV2024-11-06
TOPGLOV2024-11-06
TOPGLOVMore articles on MQTrader Education Series

Created by MQTrader Jesse | Apr 13, 2023
Created by MQTrader Jesse | Aug 06, 2021
Created by MQTrader Jesse | Nov 01, 2019


