MQ Trader – Technical Indicators (Part 2) [UNISEM]
MQTrader Jesse
Publish date: Tue, 04 Sep 2018, 05:20 PM
Introduction
In this blog post, we will be discussing on 3 of the technical indicators including Moving Average Crossover, Moving Average Convergence-Divergence (MACD) and William % R which are used in MQ Technical Analysis. This topic is the continuation of the previous blog post, please read MQ Trader – Technical Indicators (Part 1) [UNISEM] for better understanding.
MQ Technical Indicators
- Moving Average Crossover
A moving-average crossover occurs when two moving averages each based on different degrees of smoothing cross. Such a crossover can be used to signal a change in trend. The two most popular types of moving averages are the Simple Moving Average (SMA) and the Exponential Moving Average (EMA).
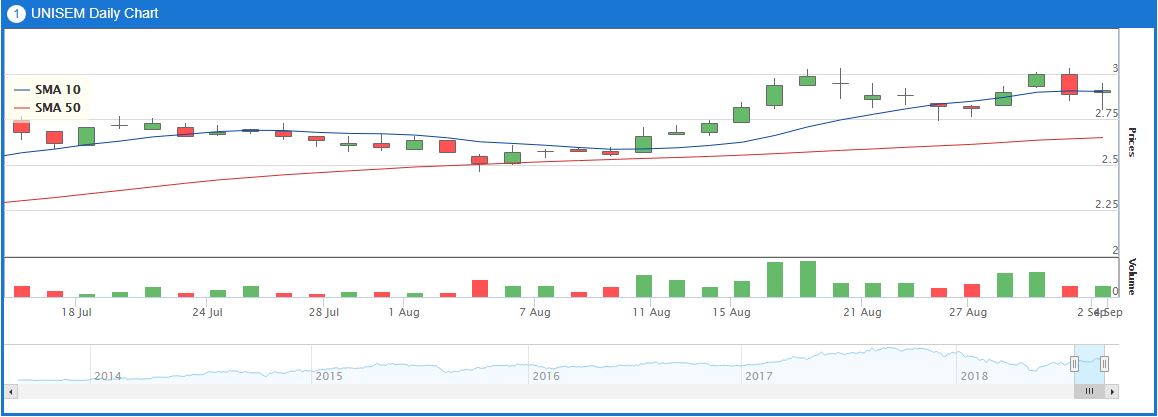
For our analysis, we look at 10 day SMA and 50 day SMA. The trend is bullish when the 10 day SMA is above the 50 day SMA, and bearish if 10 day SMA is below 50 day SMA.

Source: MQ Trader Stock Analysis System

Figure 1: SMA 10 and SMA 50 in daily technical chart of UNISEM
According to Figure 1, SMA 10 is above SMA 50 in UNISEM daily technical chart. This means that the current trend of UNISEM’s price movement is bullish, as average share price in these 20 days is higher than the average share price in the past 50 days.
To view the technical chart, please visit Moving Average Crosser Technical Chart.
As compared to EMA, SMA produces more lagging effect, as SMA is computed by averaging weightage of the share price over the past share price evenly while the calculation of EMA put higher priority or weightage on the most recent share price. If you would like to find out more about EMA Crossover, you can refer to MQ Trader Strategy – EMA 5 Crossover for more information.
- Moving Average Convergence-Divergence (MACD)
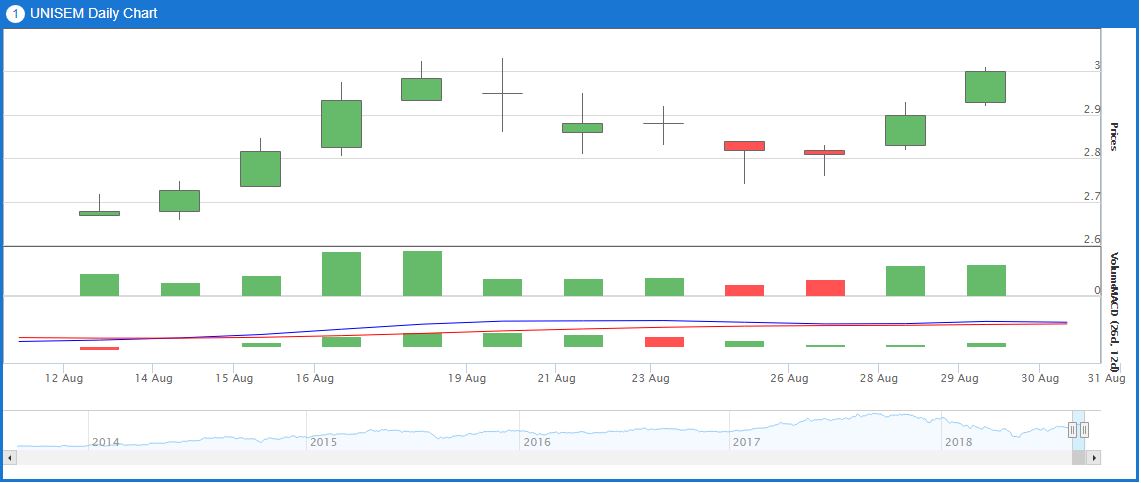
MACD is a trend-following momentum indicator that shows the relationship between two moving averages of prices. The MACD is calculated by subtracting the 26-day exponential moving average (EMA) from the 12-day EMA. A nine-day EMA of the MACD, called the "signal line", is then plotted on top of the MACD, functioning as a trigger for buy and sell signals. The indicator is bullish when the MACD rises above the signal line, and is bearish when the MACD falls below the signal line.

Source: MQ Trader Stock Analysis System

Figure 2: MACD trend in UNISEM’s daily technical chart
Figure 2 shows that MACD is still above the signal line, so UNISEM’s price movement is still considered as bullish. To know more about MACD, please visit MQ Trader Strategy – MACD and RSI.
To see the technical chart in a clearer view, please proceed to MACD Technical Chart.
- William % R
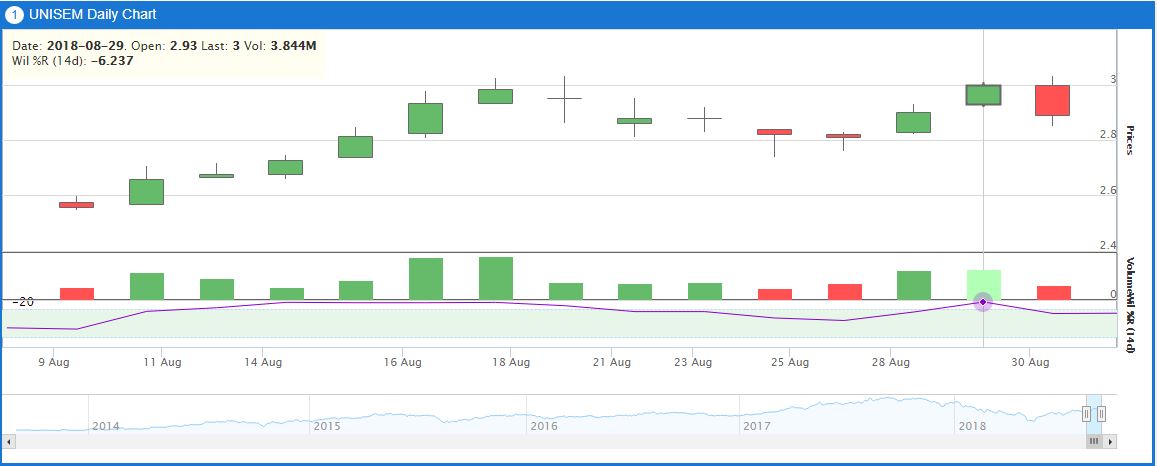
William %R is a momentum indicator that reflects the level of the close relative to the highest high for the look-back period. William %R oscillates from 0 to -100. Readings from 0 to -20 are considered overbought. Readings from -80 to -100 are considered oversold.
Calculation of William %R:
%R = (highest high – closing price) / (highest high – lowest low) x -100

Source: MQ Trader Stock Analysis System

Figure 3: William % R in UNISEM’s daily technical chart
Based on Figure 3, William % R shows -6.237 which falls in the range of 0 to -20, so its current trend is categorized as Overbought which indicates that the share is traded above its true value.
To see the technical chart, kindly view William % R Technical Chart for more details.
The rest of the technical indicators will be explained in our next blog post – MQ Trader – Technical Indicators (Part 3) [UNISEM]. To know more about Technical Indicators, please visit MQ Trader – Variables of Technical Screener.
Community Feedback
We encourage traders to try out and evaluate the MQ Trader system and provide us feedback on the features you like to see in the system. We have received many positive feedbacks so far, and we are currently compiling and reviewing them for possible inclusion into the next release of the system.
We would like to develop this system based on community feedback to cater for community needs. Thanks to all those who have provided valuable feedback to us. Keep those feedbacks coming in!
Disclaimer
This article does not represent a BUY or SELL recommendation on the stock covered. Traders and Investors are encouraged to do their own analysis on stocks instead of blindly following any Trading calls raised by various parties in the Internet. We may or may not hold position in the stock covered, or initiate new position in the stock within the next 7 days.
Join us now!
MQ Trader stock analysis system uses Artificial Intelligence (AI), various technical indicators and quantitative data to generate accurate trading signals without the interference of human's emotions and bias against any particular stock. It comprises trading strategies which are very popular among fund managers for analysing stocks.
MQ Trader stock analysis system is SPONSORED for MQ Trader members. To use this amazing tool, you can sign up via MQ Trader Sign Up!
Contact us
Please do not hesitate to contact us if you have any enquiry:
Related Stocks
| Chart | Stock Name | Last | Change | Volume |
|---|
Market Buzz
2024-11-17
UNISEM2024-11-15
UNISEM2024-11-15
UNISEM2024-11-15
UNISEM2024-11-15
UNISEM2024-11-15
UNISEM2024-11-15
UNISEM2024-11-13
UNISEM2024-11-13
UNISEM2024-11-07
UNISEM2024-11-07
UNISEM2024-11-07
UNISEM2024-11-07
UNISEM2024-11-07
UNISEM2024-11-07
UNISEM2024-11-07
UNISEM2024-11-07
UNISEM2024-11-06
UNISEM2024-11-06
UNISEM2024-11-06
UNISEM2024-11-06
UNISEM2024-11-06
UNISEM2024-11-06
UNISEMMore articles on MQTrader Education Series

Created by MQTrader Jesse | Apr 13, 2023
Created by MQTrader Jesse | Aug 06, 2021
Created by MQTrader Jesse | Nov 01, 2019


