MQ Trader – Technical Indicators (Part 4) [UNISEM]
MQTrader Jesse
Publish date: Thu, 06 Sep 2018, 03:45 PM
Introduction
In this article, we will be explaining on the last 2 technical indicators which are stochastic oscillator and average directional index (ADX) that are used in MQ Technical Analysis. This post is the continuation of the previous post, so it is recommended for you to read our previous post – MQ Trader – Technical Indicators (Part 3) [UNISEM] to have a better understanding on this topic.
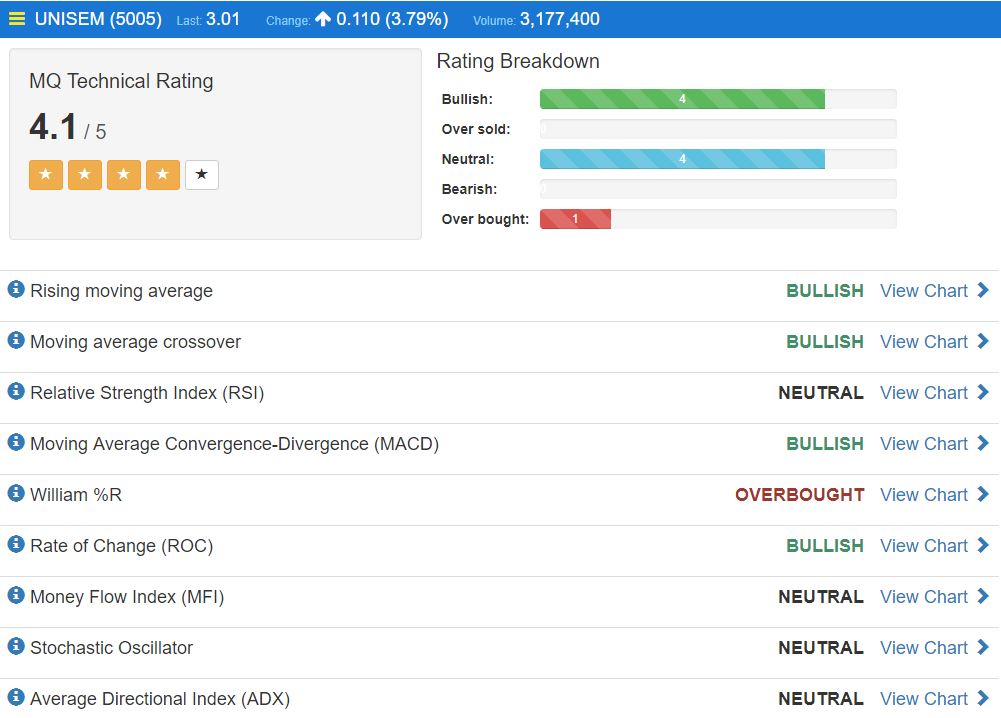
MQ Technical Indicators

Source: MQ Trader Stock Analysis System
- Stochastic Oscillator
The Stochastic Oscillator is a momentum indicator that shows the location of the close relative to the high-low range over a set number of periods. As a rule, the momentum changes direction before price. As such, bullish and bearish divergences in the Stochastic Oscillator can be used to foreshadow reversals.
Calculation of stochastic oscillator:
%K = 100(C - L14)/(H14 - L14)
Where:
C = the most recent closing price
L14 = the low of the 14 previous trading sessions
H14 = the highest price traded during the same 14-day period
%K= the current market rate for the currency pair
%D = 3-period moving average of %K
The oscillator ranges from zero to one hundred. Traditional settings use 80 as the overbought threshold and 20 as the oversold threshold.
Bullish: when the fast stochastic oscillator (Stoch %K) crosses above the slow stochastic oscillator (Stoch %D) and it is in the oversold (below 20) treshold
Bearish: when Stoch %K crosses below Stoch %D and it is in the overbought (above 80) threshold

Source: MQ Trader Stock Analysis System

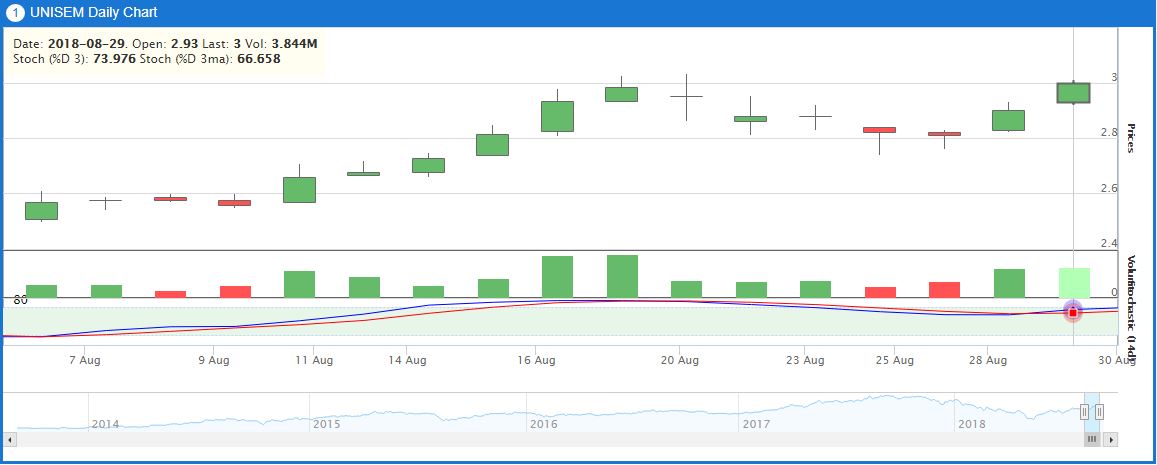
Figure 1: Stochastic Oscillator in UNISEM’s daily technical chart
To filter the noise of stochastic oscillator, D% and K% are multiplied with 3 days moving averages to obtain D% 3MA and D% respectively to form smoother curves as shown in Figure 1.
According to Figure 1, the fast stochastic oscillator (Stoch %K) crosses above the slow stochastic oscillator (Stoch %D) but its value is 73.976 which is lesser than 80. Hence, UNISEM’s share price movement is rated as neutral with the trend more towards to bullish at the moment.
To view the technical chart in MQ Trader system, please proceed to Stochastic Oscillator Technical Chart.
- Average Directional Index (ADX)
The Average Directional Index (ADX) is used to determine when price is trending strongly. In many cases, it is the ultimate trend indicator. Trading in the direction of a strong trend reduces risk and increases profit potential. To know more about ADX, kindly read MQ Trader Strategy - ADX Crossover.
Bullish: when Plus Directional Indicator (+DI) is above Minus Directional Indicator (-DI) and ADX is more than 25
Bearish: when Plus Directional Indicator (+DI) is below Minus Directional Indicator (-DI) and ADX is more than 25

Source: MQ Trader Stock Analysis System

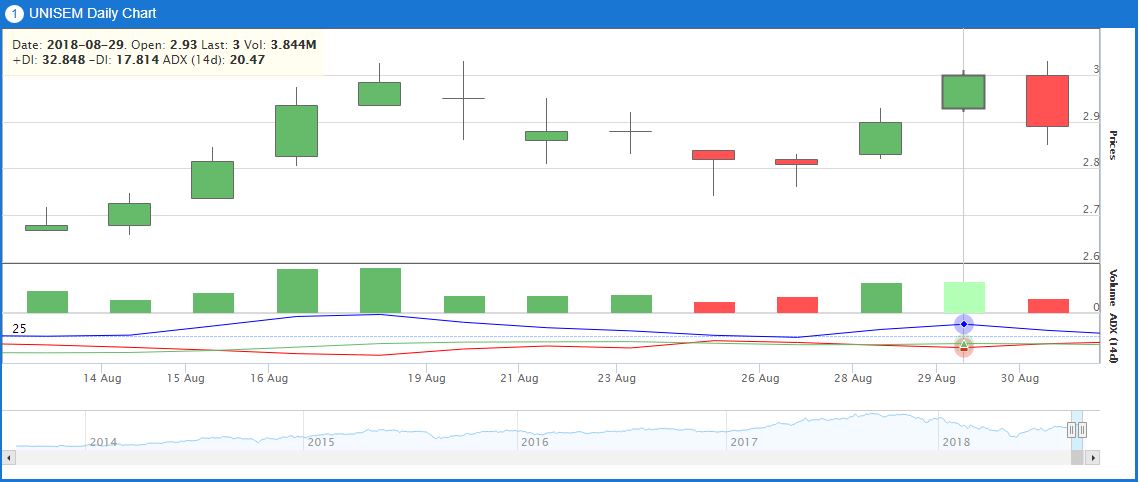
Figure 2: ADX in UNISEM’s daily technical chart
Figure 2 shows that the +DI crosses above –DI while ADX reached 20.47 which is lower than 25, so it is categorized as neutral with the trend is more towards bullish range.
For accessing to the technical chart in MQ Trader system, you can visit ADX Technical Chart.
Conclusion
Technical indicators are very important to predict the future share price by using the historical data, as there are many case studies that have been proven that history always repeats itself. However, it is impossible for us to have technical analysis on the hundreds of shares daily to identify the shares with bullish trend. Thus, both MQ technical screener and MQ Technical Rating play vital roles in filtering the shares with bullish trend within seconds. For more information, you can read MQ Trader – Technical Screener for Up-trending Stocks and MQ Trader – Technical Analysis [UNISEM] for understanding how technical screener and technical rating works in MQ Trader stock analysis system.
Community Feedback
We encourage traders to try out and evaluate the MQ Trader system and provide us feedback on the features you like to see in the system. We have received many positive feedbacks so far, and we are currently compiling and reviewing them for possible inclusion into the next release of the system.
We would like to develop this system based on community feedback to cater for community needs. Thanks to all those who have provided valuable feedback to us. Keep those feedbacks coming in!
Disclaimer
This article does not represent a BUY or SELL recommendation on the stock covered. Traders and Investors are encouraged to do their own analysis on stocks instead of blindly following any Trading calls raised by various parties in the Internet. We may or may not hold position in the stock covered, or initiate new position in the stock within the next 7 days.
Join us now!
MQ Trader stock analysis system uses Artificial Intelligence (AI), various technical indicators and quantitative data to generate accurate trading signals without the interference of human's emotions and bias against any particular stock. It comprises trading strategies which are very popular among fund managers for analysing stocks.
MQ Trader stock analysis system is SPONSORED for MQ Trader members. To use this amazing tool, you can sign up via MQ Trader Sign Up!
Contact us
Please do not hesitate to contact us if you have any enquiry:
Related Stocks
| Chart | Stock Name | Last | Change | Volume |
|---|
Market Buzz
2024-11-17
UNISEM2024-11-15
UNISEM2024-11-15
UNISEM2024-11-15
UNISEM2024-11-15
UNISEM2024-11-15
UNISEM2024-11-15
UNISEM2024-11-13
UNISEM2024-11-13
UNISEM2024-11-07
UNISEM2024-11-07
UNISEM2024-11-07
UNISEM2024-11-07
UNISEM2024-11-07
UNISEM2024-11-07
UNISEM2024-11-07
UNISEM2024-11-07
UNISEM2024-11-06
UNISEM2024-11-06
UNISEM2024-11-06
UNISEM2024-11-06
UNISEM2024-11-06
UNISEM2024-11-06
UNISEMMore articles on MQTrader Education Series

Created by MQTrader Jesse | Apr 13, 2023
Created by MQTrader Jesse | Aug 06, 2021
Created by MQTrader Jesse | Nov 01, 2019


