RHB Retail Research
Technical Analysis - Karyon Industries
rhboskres
Publish date: Thu, 09 Aug 2018, 09:59 AM
Karyon Industries

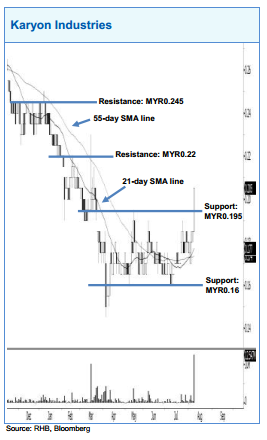
Karyon Industries formed a long white candle, indicating that the momentum of buying could be strong. As the 21-day SMA line has crossed above the 55-day SMA line lately, this is an indication of a positive sign. A bullish bias may emerge above the MYR0.195 level, with an exit set below the MYR0.16 threshold. Towards the upside, the immediate resistance is at MYR0.22. This is followed by the MYR0.245 level.
Source: RHB Securities Research - 9 Aug 2018
Related Stocks
| Chart | Stock Name | Last | Change | Volume |
|---|
More articles on RHB Retail Research
Duopharma Biotech - Lacking Near-Term Re-Rating Catalysts; D/G NEUTRAL
Created by rhboskres | Aug 26, 2024
Discussions
Be the first to like this. Showing 0 of 0 comments


