KUALA LUMPUR COMPOSITE INDEX—KLCI 2000?
thebodhisattvatrader
Publish date: Mon, 27 Apr 2015, 03:45 AM

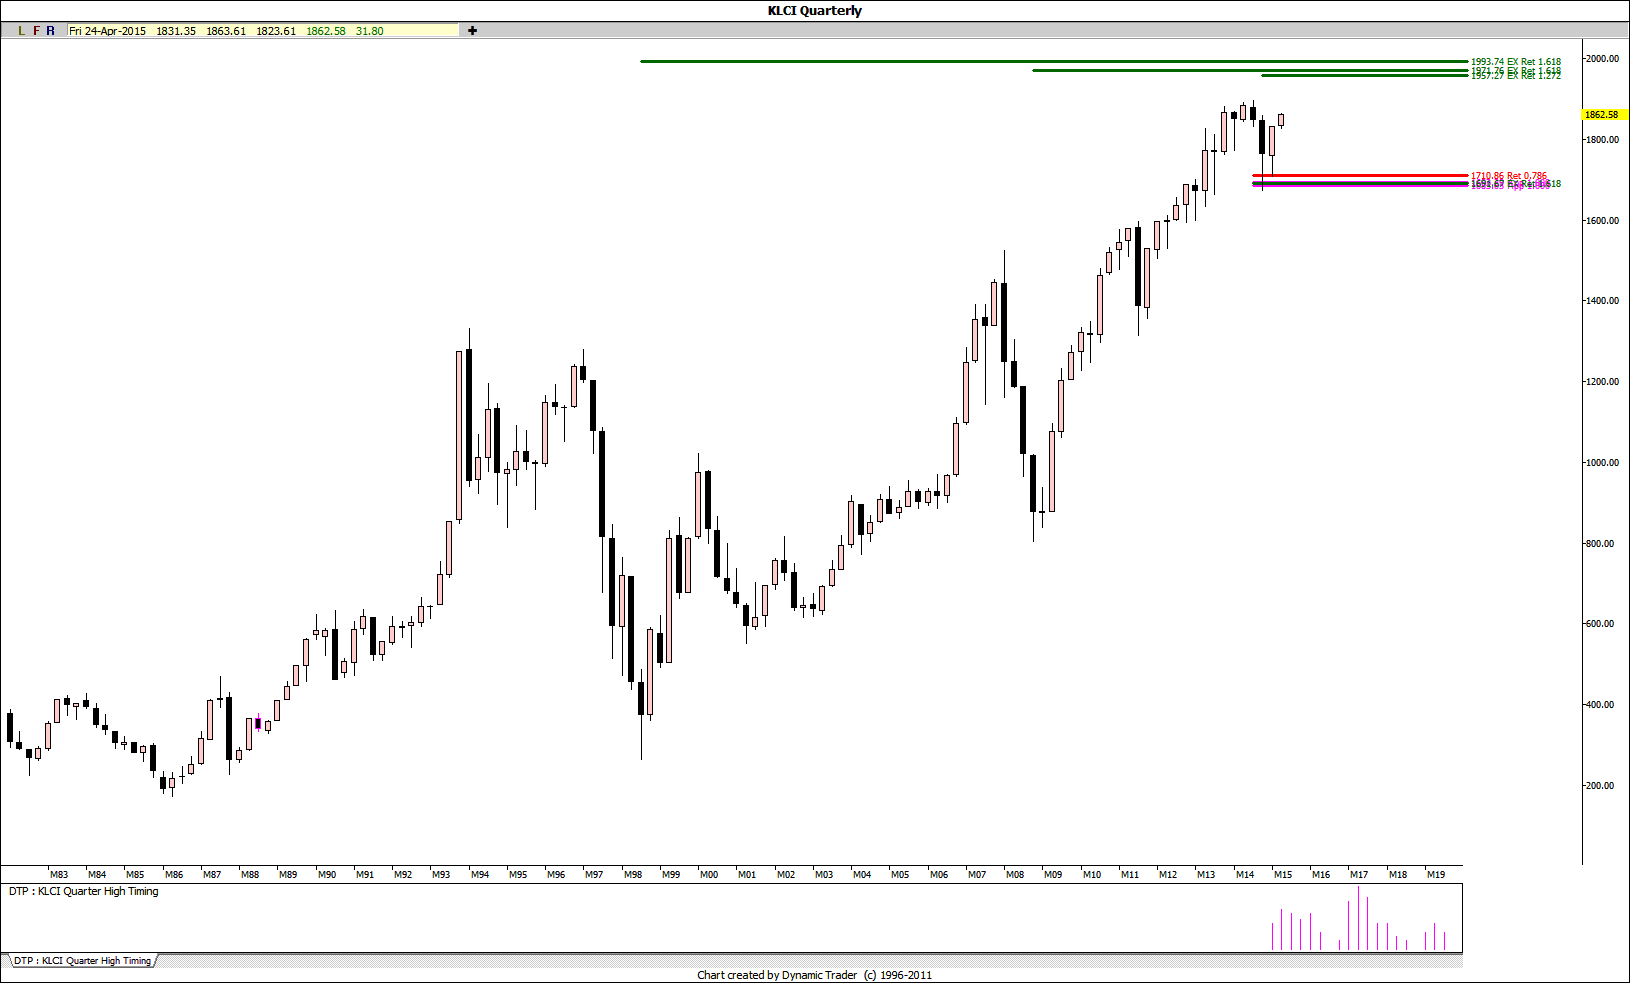
The KLCI held Bullish Symmetry back in December ’14. Targets, including a major target from the 1994 to 1998 swing, remain from 1957 to 2000.

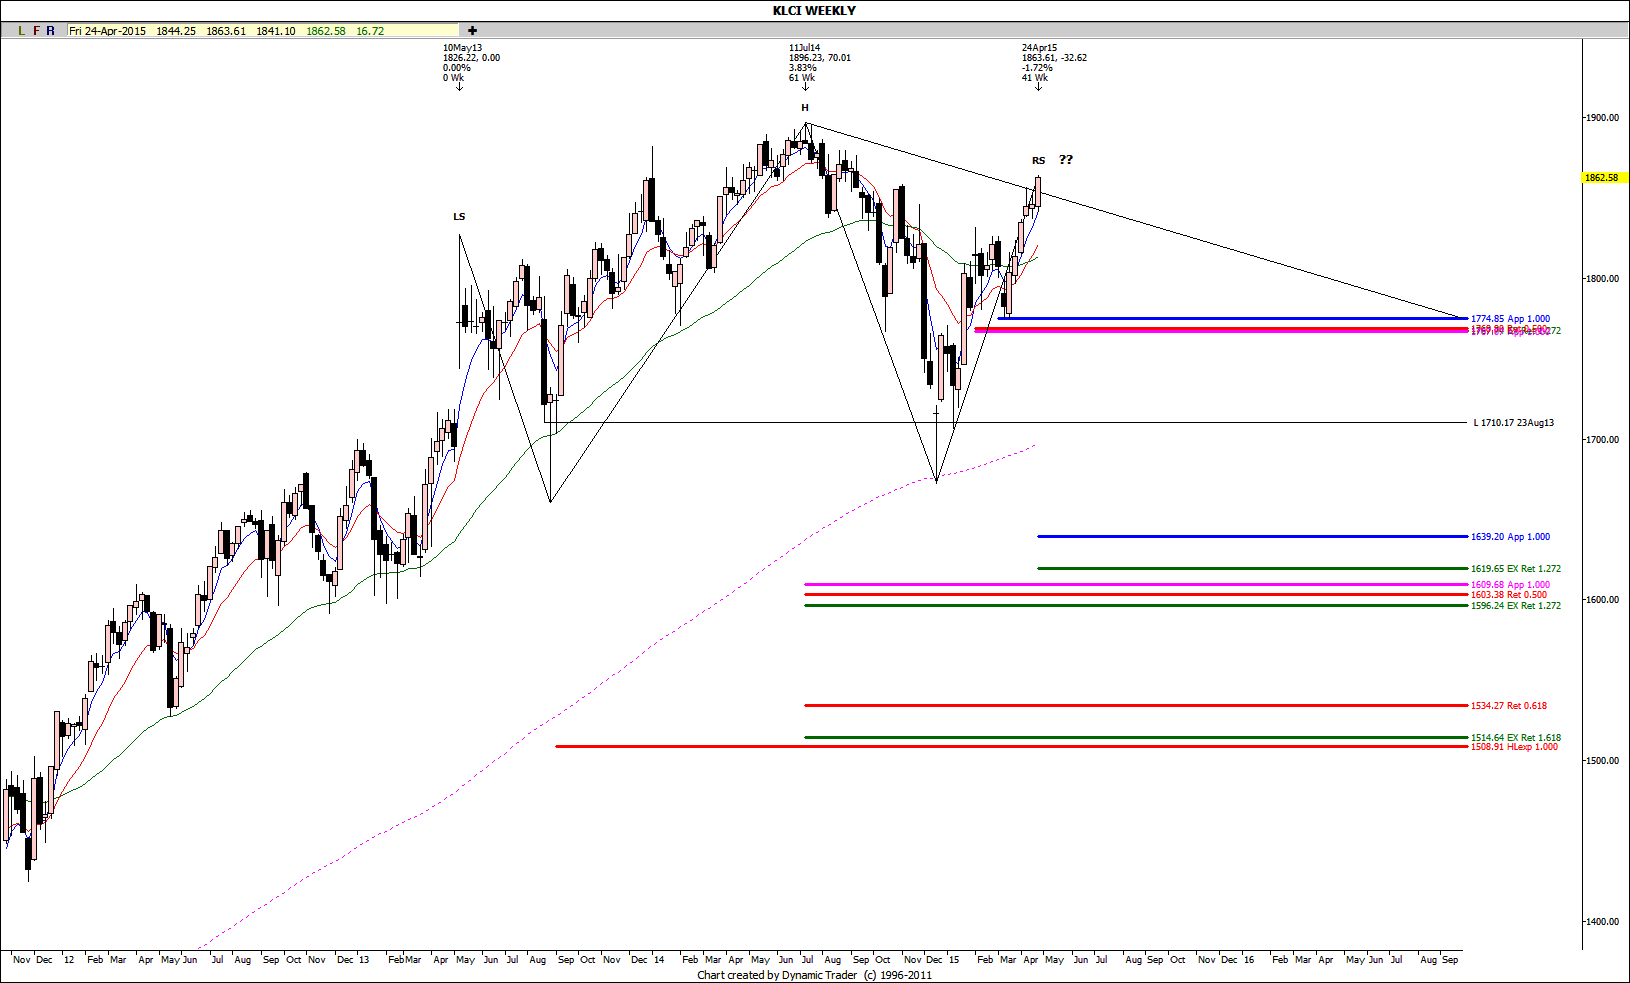
However, the KLCI has been trading in a sideways chop since May ’13. A bearish interpretation of a possible bearish Head & Shoulders top or a bearish Descending Triangle cannot be ruled out. After last week’s strong rally, the bearish Head & Shoulders top pattern appears to be weakening although the bearish Descending Triangle is still very much in play. Target is at 1500.
Chart analysis and trading methodology are based primarily on classical charting principles and Fibonacci analysis as defined and described by Robert Edwards & John Magee (Technical Analysis Of Stock Trends), Richard W. Schabacker (Technical Analysis And Stock Market Profits), Peter L. Brandt (Diary Of A Professional Commodity Trader) and Carolyn Boroden (Fibonacci Trading).
More articles on The Bodhisattva Trader
Created by thebodhisattvatrader | Jun 02, 2015


