


AmInvest Research Reports
Stocks on Radar - MISC (3816)

AmInvest
Publish date: Wed, 23 Feb 2022, 11:35 AM
AmInvest
0 9,374
An official blog in I3investor to publish research reports provided by AmInvest research team.
All materials published here are prepared by AmInvest. For latest offers on AmInvest trading products and news, please refer to: https://www.aminvest.com/eng/Pages/home.aspx
Tel: +603 2036 1800 / +603 2032 2888
Fax: +603 2031 5210
Email: enquiries@aminvest.com
Office Hours
Monday to Thursday: 8:45am – 5:45pm
Friday: 8:45am – 5:00pm
(GMT +08:00 Malaysia)
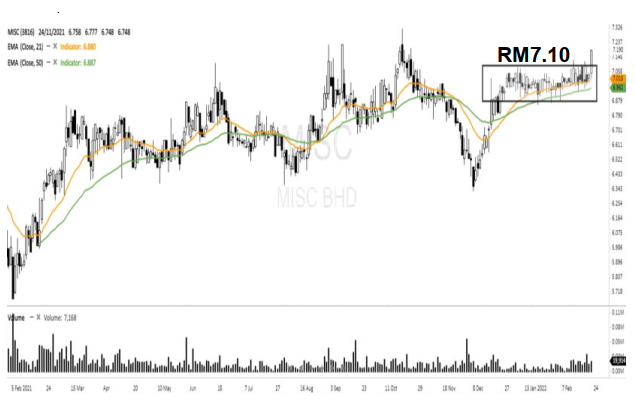
MISC broke out from its 2-month bullish rectangle pattern yesterday implying that its previous uptrend may have resumed. As the 21-day and 50-day EMAs have established their bullish crossover since late Dec 2021, the stock looks positive in the near term. A bullish bias may emerge above the RM7.10 level, while setting a stop-loss at RM6.98. Towards the upside, we are eyeing the nearterm resistance level at RM7.60, followed by RM7.90.
Entry: RM7.10–7.19
Target: RM7.60, 7.90
Exit: RM6.98
Source: AmInvest Research - 23 Feb 2022
Related Stocks
| Chart | Stock Name | Last | Change | Volume |
|---|
Market Buzz
2024-11-20
MISC2024-11-20
MISC2024-11-20
MISC2024-11-20
MISC2024-11-19
MISC2024-11-19
MISC2024-11-18
MISC2024-11-18
MISC2024-11-18
MISC2024-11-15
MISC2024-11-15
MISC2024-11-15
MISC2024-11-15
MISC2024-11-15
MISC2024-11-15
MISC2024-11-15
MISC2024-11-15
MISC2024-11-14
MISC2024-11-14
MISC2024-11-14
MISC2024-11-14
MISC2024-11-14
MISC2024-11-14
MISC2024-11-13
MISC2024-11-13
MISC2024-11-13
MISC2024-11-12
MISC2024-11-12
MISC2024-11-12
MISC2024-11-12
MISC2024-11-12
MISC2024-11-11
MISCMore articles on AmInvest Research Reports
Banking - Limited sector ROE expansion with moderated earnings growth
Created by AmInvest | Nov 18, 2024
UOA REAL Estate Investment Trust - Lower occupancy rate for Menara UOA Bangsar
Created by AmInvest | Nov 15, 2024
Discussions
Be the first to like this. Showing 0 of 0 comments
Post a Comment
Featured Posts


Latest Videos


MQ Trading Signals
Time
Signal
Duration
Type
2024-11-20 16:35:00
EMA 5
5 Mins
SELL
2024-11-20 16:30:00
EMA 5
5 Mins
BUY
2024-11-20 16:30:00
OBV
10 Mins
SELL
2024-11-20 16:20:00
EMA 5
10 Mins
SELL
2024-11-20 16:20:00
EMA 5
5 Mins
SELL
Apps


Top Articles
1
2
3
save malaysia!
4
5
7
8
AmInvest Research Reports
#
Stock
Score
Daily Stocks
Stock Name
Last
Change
Volume
Stock Name
Last
Change
Volume
Stock Name
Last
Change
Volume
Featured Advertisers / Partners


Ride The Bull Short The Bear
CS Tan
4.9 / 5.0
This book is the result of the author's many years of experience and observation throughout his 26 years in the stockbroking industry. It was written for general public to learn to invest based on facts and not on fantasies or hearsay....