AmInvest Research Reports
Stocks on Radar - Kumpulan Fima
AmInvest
Publish date: Mon, 04 Jul 2022, 09:21 AM

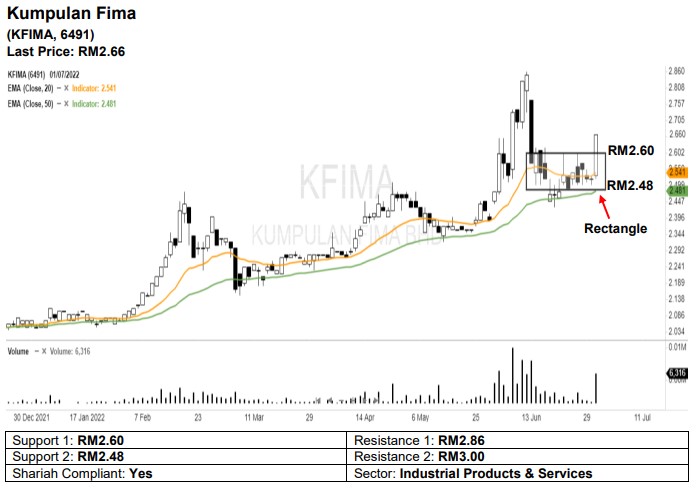
Kumpulan Fima broke out from its 3-week rectangle pattern with a long white candle on Friday, implying that a bullish reversal sign may have occurred. The 20-day EMA is turning upwards while the 50-day EMA has a positive slope, suggesting additional strength may be present in the coming sessions. A bullish bias may emerge above the RM2.60 level, with a stop-loss set at RM2.46, below the 50-day EMA. Towards the upside, the near-term resistance level is seen at RM2.86, followed by RM3.00.
Entry : RM2.60–2.66
Target : RM2.86, RM3.00
Exit : RM2.46
Source: AmInvest Research - 4 Jul 2022
Related Stocks
| Chart | Stock Name | Last | Change | Volume |
|---|
Market Buzz
More articles on AmInvest Research Reports
Petronas Chemicals - Closing in to floor on multi-year low foreign holdings
Created by AmInvest | Nov 21, 2024
Discussions
Be the first to like this. Showing 0 of 0 comments


