


FKLI Updates
Daily Futures Commentaries: [FKLI Malaysia Index] 6/7/2018 - Will Malaysia follow US to rebound and retest 1700?

InvestorsDoctor
Publish date: Fri, 06 Jul 2018, 08:54 AM
InvestorsDoctor
0 1,969
Here we update timely info about FKLI
To get more information on local and foreign futures markets, u can join us at telegram and Facebook.
Join link: https://t.me/investorsdoctoracademy
Facebook: https://m.facebook.com/investorsdoctoracademy/
To get more information on local and foreign futures markets, u can join us at telegram and Facebook.
Join link: https://t.me/investorsdoctoracademy
Facebook: https://m.facebook.com/investorsdoctoracademy/
6/7/2018
*FKLI Jul 18*
Previous Close: 1686 -2.5
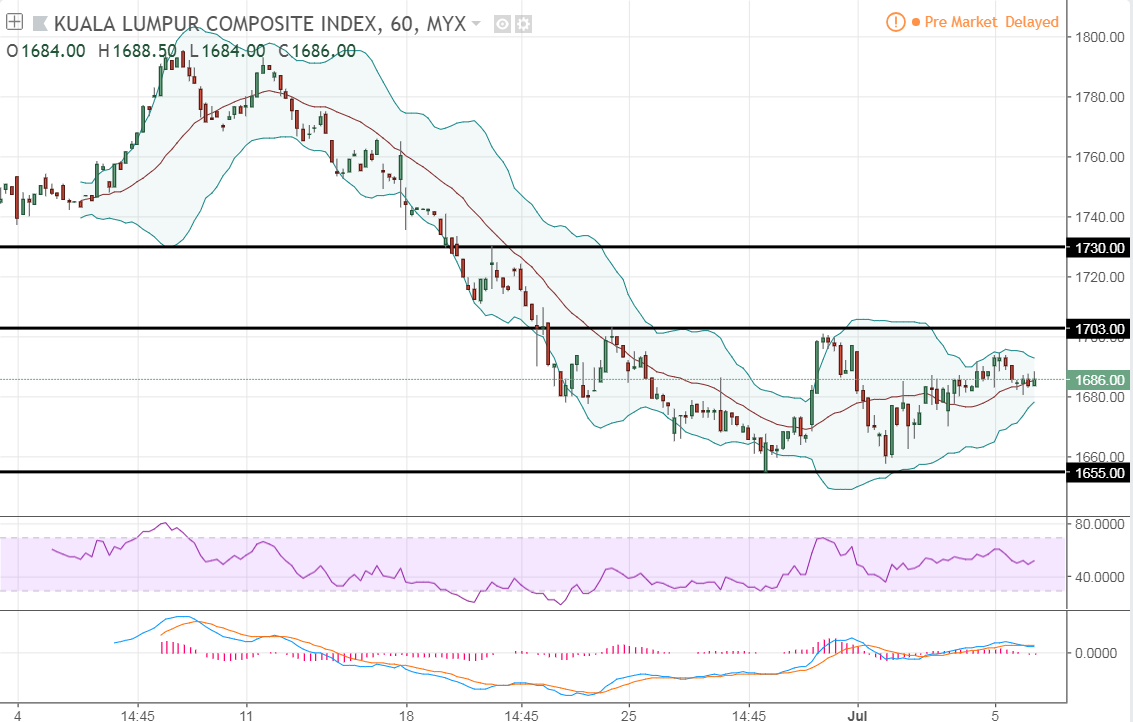
FKLI closed mostly unchanged yesterday after more to bearish Msia balance of trade data and foreign fund selling. US stock market resumed with more than 180pts gains, FKLI may gap up and test resistance.
Daily chart show FKLI traded within previous range, wait for breakout, while hourly chart's technical indicators moving upside, showed FKLI in rebound stage.
*Classic Support & Resistance*
Resistance: 1703 1730
Support: 1670 1655
*Recommend Trading Plan for the day:*
1. Buy 1689, stop 1685, profit 1693/1697.
2. Look for sell signal if unable to sustain above 1680.
*FKLI Margin Requirement*
Intraday MYR 2000
Overnight MYR 4000
Spread MYR 500
Disclaimer: Idea sharing only, trade at your own risk.
Join our channels to find out more!
Telegram link:
https://t.me/investorsdoctoracademy
Facebook link: https://m.facebook.com/investorsdoctoracademy
Since 14th May 2018 (stock market reopened after 509 GE-14), FKLI Futures dropped nearly 200.5 points from high 1876.5 to recent low 1676!
Simple Calculation:
200.5 x RM 50 per index point = RM 10,025 (Potential Profit!)
Well, NOW is the time for you to understand more about FKLI Trading!
Come & Join us on 14th July 2018 from 2PM to 4PM at SI Academy.
IDA will discover together with You - What is FKLI............
https://goo.gl/forms/SyxDaLNwkuYagkA02


More articles on FKLI Updates
Daily Futures Commentaries: [FKLI Malaysia Index] 30/12/2019 - 1595 or 1620 wait for breakout
Created by InvestorsDoctor | Dec 30, 2019
Discussions
Be the first to like this. Showing 0 of 0 comments
Post a Comment
Featured Posts


Latest Videos


Apps


Top Articles
1
Koon Yew Yin's Blog
2
Good Articles to Share
3
https://dividendguy67.blogspot.com
4
5
7
save malaysia!
#
Stock
Score
Daily Stocks
Stock Name
Last
Change
Volume
Stock Name
Last
Change
Volume
Stock Name
Last
Change
Volume
MQ Trading Signals
Stock
Time
Signal
Duration
Stock
Time
Signal
Duration
Featured Advertisers / Partners


Ride The Bull Short The Bear
CS Tan
4.9 / 5.0
This book is the result of the author's many years of experience and observation throughout his 26 years in the stockbroking industry. It was written for general public to learn to invest based on facts and not on fantasies or hearsay....