


FKLI Updates
Daily Futures Commentaries: [FKLI Malaysia Index] 20/7/2018 - Technical correction after strong rebound, but foreign fund net sell again

InvestorsDoctor
Publish date: Fri, 20 Jul 2018, 08:35 AM
InvestorsDoctor
0 1,969
Here we update timely info about FKLI
To get more information on local and foreign futures markets, u can join us at telegram and Facebook.
Join link: https://t.me/investorsdoctoracademy
Facebook: https://m.facebook.com/investorsdoctoracademy/
To get more information on local and foreign futures markets, u can join us at telegram and Facebook.
Join link: https://t.me/investorsdoctoracademy
Facebook: https://m.facebook.com/investorsdoctoracademy/
20/7/2018
*FKLI Jul 18*
Previous Close: 1756.5 -2.5
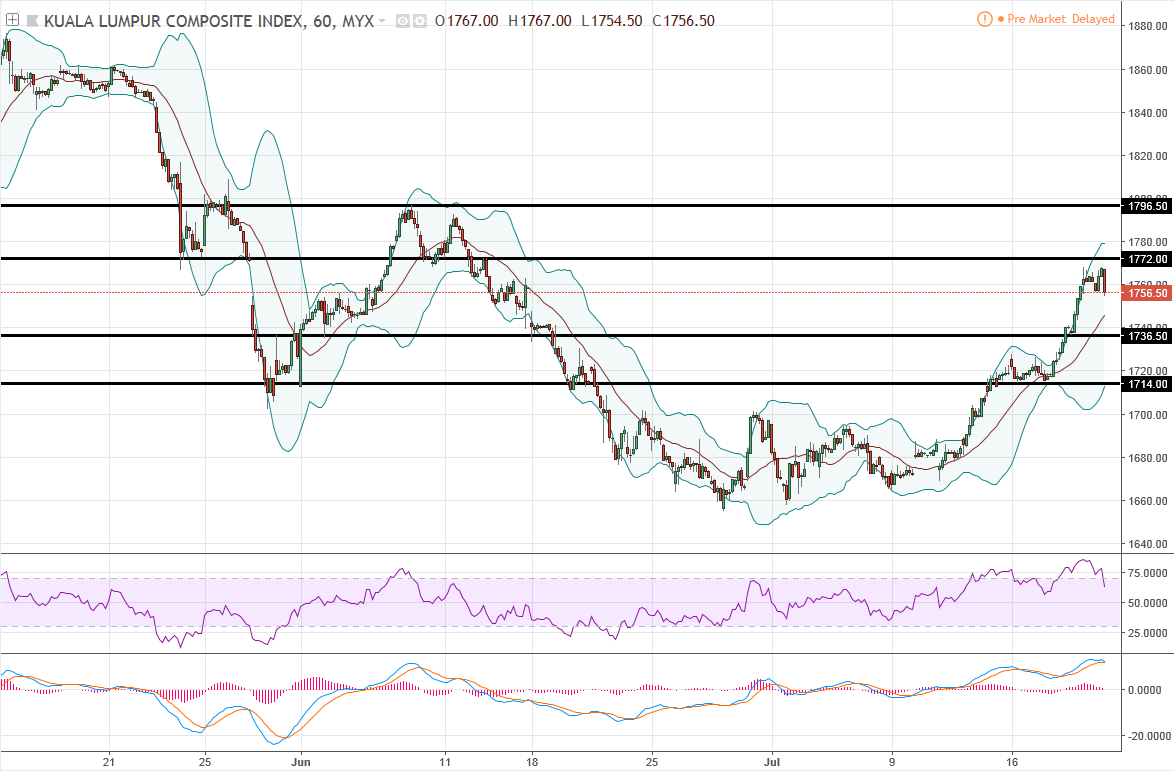
FKLI eased off from high of around 1770 on profit taking after a sharp gain and pressured by foreign fund selling. US stock market dropped more than 130pts, FKLI may gap down and test support 1st.
Daily chart formed a correction candle, wait today closing for confirmation, may try to pull back price to inside of BB. Hourly chart show a RSI overbought correction.
*Classic Support & Resistance*
Resistance: 1772 1796.5
Support: 1736.5 1714
*Recommend Trading Plan for the day:*
1. Sell 1754 for technical correction, stop 1758, profit 1750/1746.
2. Look for buy signal above 1768.
*FKLI Margin Requirement*
Overnight MYR 4000
Spread MYR 500
Disclaimer: Idea sharing only, trade at your own risk.
Join our channels to find out more!
Telegram link:
https://t.me/investorsdoctoracademy
Facebook link: https://m.facebook.com/investorsdoctoracademy

[Free English Seminar]
期货&原产品投资交易- 赌博?高风险投资?需要大笔资金?
Futures & Commodities Trading - Gambling? High Risk? Require Big Capital?
不对!如果您一直以来有这样的想法,是时候让IDA 破解您对期货交易的迷思和误解!
NO! Time to Crack All The Myths of Trading Commodities Futures!
Myth 1: Trading is all about making Fash-Cash!
Myth 2: You must have perfect timing to pick highs & lows.
Myth 3: You need a lot of money to start strading.
Myth 4: You must know what will happen next.
Myth 5: You can only make money in trending markets or 'easy' market conditions etc............
IDA will make you fully awake and hate yourself for not knowing about futures trading 20-30 years earlier!
Register Now! Whatsapp to 011-5353 7589 OR
Click the link below: https://goo.gl/forms/shBJRmtlooDpcvyj1
More articles on FKLI Updates
Daily Futures Commentaries: [FKLI Malaysia Index] 30/12/2019 - 1595 or 1620 wait for breakout
Created by InvestorsDoctor | Dec 30, 2019
Discussions
Be the first to like this. Showing 0 of 0 comments
Post a Comment
Featured Posts


Latest Videos


Apps


Top Articles
1
Koon Yew Yin's Blog
2
Good Articles to Share
3
https://dividendguy67.blogspot.com
4
5
7
save malaysia!
#
Stock
Score
Daily Stocks
Stock Name
Last
Change
Volume
Stock Name
Last
Change
Volume
Stock Name
Last
Change
Volume
MQ Trading Signals
Stock
Time
Signal
Duration
Stock
Time
Signal
Duration
Featured Advertisers / Partners


Ride The Bull Short The Bear
CS Tan
4.9 / 5.0
This book is the result of the author's many years of experience and observation throughout his 26 years in the stockbroking industry. It was written for general public to learn to invest based on facts and not on fantasies or hearsay....