


Investing: Know Everything
Technical Analysis 技术分析: Bollinger Bands 布林线

YOLO123
Publish date: Tue, 05 Jan 2021, 12:19 PM
YOLO123
0 77
Investing: Know Everything is a page that share lots of investing knowledge, especially on a company's fundamental. However, some technical analysis will also be included if necessary, making the page more approachable to all investors.
More information, visit: https://www.facebook.com/InvestingKnowEverything/
More information, visit: https://www.facebook.com/InvestingKnowEverything/
Bollinger Bands is a tool that have two standard deviations lines plotted away from the simple moving average line.
It was designed to set a top and bottom of the price movement, identifying whether will the stock will overbought or oversold.
Bollinger Bands is calculated via standard deviation, and it can tell you the stock volatility. When there is a higher volatility, the bands will become wide, whereas a lower volatility will make the bands become narrow.
When the bands contracted, traders will see this as a potential rise in prices. On the other hand, if the bands have widen too much, it is a potential sign of the stocks will hit a bottleneck and retrace a bit. However, there is no exact indication that the stocks will do so.
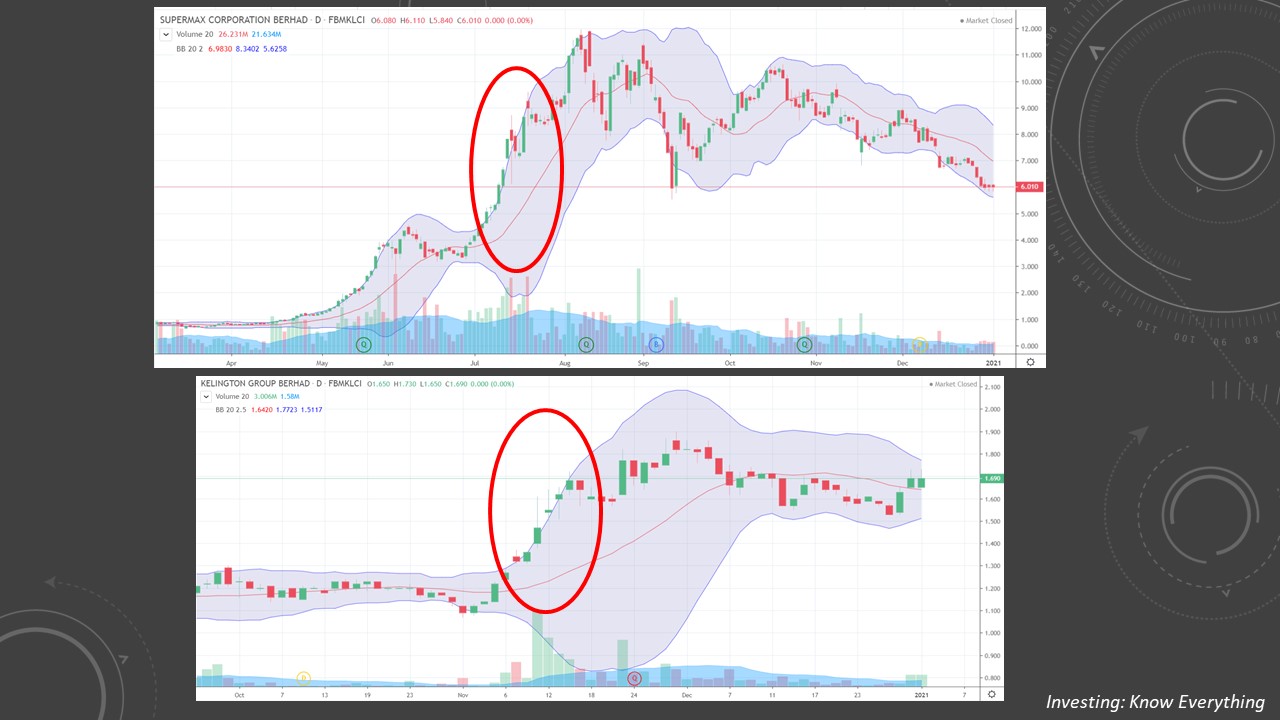
There are also people who think that a breakout or hitting the upper band is a signal to buy or sell, but this indicator does not necessary show that. A few stocks such as SUPERMX and KGB has proven that.
The biggest downside of this indicator is that it requires the assistance of other indicators, and it cannot be used alone. This is because the data used is as old as 20 days before, which in reality is a month ago, hence it cannot be seen as the latest data and the latest price movement indicator.
Ever wonder how to calculate Bollinger Bands?
Visit the wirter's Page to know more, link is located below:
布林线是一个画图工具,而它的画法是首先要有两条标准变差的线,而这两条线是会画在平均线的上方和下方。
这个指标在设计上是为了设定股价走势的顶部和底部,同时也辨认现在这个股是否已经被过卖或者过买。
布林线是通过标准偏差算出的,而他也可以告诉你这个股的流通性/浮动·。当这个股有很大的浮动时,布林线就会被拉宽,而当股价没有很浮动时,布林线就会收窄。
当布林线收缩的时候,交易者会视这个为股价上升的机会.另一方面,如果布林线扩张到太大的时候,这个股有可能会因为遇到瓶颈而回调。但是,这并没有一个肯定的指标证明这个股一定会有这样的走势。
也有一些人认为当一个股突破了或者一直碰到上布林线就是买卖信号,其实这个指标并没有这个作用。例如SUPERMX和KGB等的几个股都可以证明如此。
这个指标最大的缺点就是它需要其他指标的协助,而不能够自己单独被使用。这是因为他所用的咨询是20个交易日以前的,也就是一个月前的事情,所以并不能够被视为最新的资料或者最新的股价走势。
曾经想过怎样算出布林线吗?
浏览笔者的网页以知道更多,链接在下面:
Find out more at (更多资讯,请在笔者的专业观看) : https://www.facebook.com/InvestingKnowEverything/
More articles on Investing: Know Everything
Different Mind-set = Different Investing and Trading Style (不同的心态等于不同的投资或者交易方法)
Created by YOLO123 | Feb 02, 2021
Discussions
Be the first to like this. Showing 0 of 0 comments
Post a Comment
Featured Posts
Introducing MY's First IPO Fund for Sophisticated Investors!
New Update. Discover investment communities that resonate with your ideas
M & A Value Partners IPO Equity Fund has been launched - Targeted 13% Return p.a
Latest Videos


Apps


Top Articles
1
Koon Yew Yin's Blog
2
3
Good Articles to Share
4
Koon Yew Yin's Blog
Why all plantation companies will continue to report more profit - Koon Yew Yin
5
6
Mercury Securities Research
7
8
AmInvest Research Reports
#
Stock
Score
Daily Stocks
Stock Name
Last
Change
Volume
Stock Name
Last
Change
Volume
Stock Name
Last
Change
Volume
MQ Trading Signals
Stock
Time
Signal
Duration
Stock
Time
Signal
Duration
Featured Advertisers / Partners


Ride The Bull Short The Bear
CS Tan
4.9 / 5.0
This book is the result of the author's many years of experience and observation throughout his 26 years in the stockbroking industry. It was written for general public to learn to invest based on facts and not on fantasies or hearsay....