


KLSE Stocks Review
DSONIC (5216) The Story behind the Chart of DATASONIC GROUP BERHAD

ChartStory72
Publish date: Mon, 18 Apr 2022, 12:48 PM
ChartStory72
0 211
We post FREE chart reviews on KLSE daily Top Gainers and Most Actively Traded Counters. We are also giving out free reviews for our subs as well. Come join us on Telegram and PM us to learn more and request for the stocks you need reviewing for FREE.
Facebook : https://www.facebook.com/thechartstory
Telegram : https://t.me/thechartstory
Facebook : https://www.facebook.com/thechartstory
Telegram : https://t.me/thechartstory
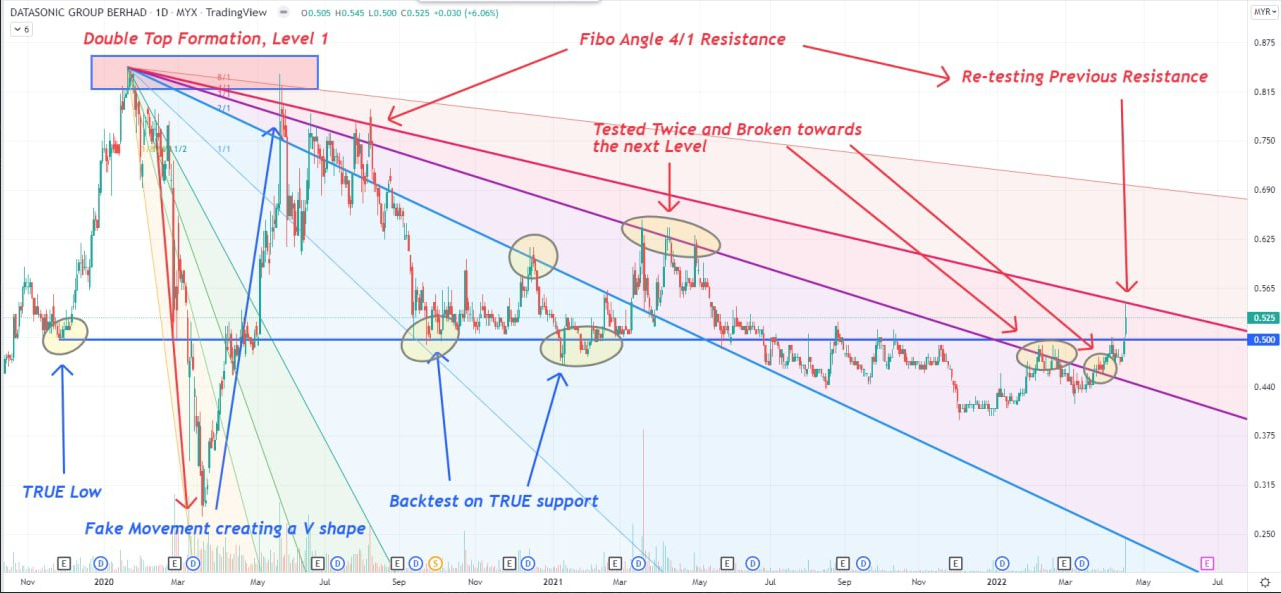
Dsonic 5216
First, notice before the deep V pattern, the TRUE support was established subtlely, hidden in plain sight. Prices proceed to crash and instantly flew back up creating a Fake move causing lots of panic and potentially a move made by the bankers to disrupt the 'Chart Patterns' of the chart.
That way, many 'traders' lost their ability to analyze the market and it is their intention all along. Prices proceed to form a Double Top Formation creating a Level 1 Fibonacci formation. To further confirm the TRUE support, we can see that prices have been rebounding at that level Multiple times as support and resistance.
At the same time, Multiple hidden Fibonacci Angle Resistances can be seen at the back as well. The 2 most significant levels are the 3/1 and 4/1 as it had been tested Multiple Times in the past. Once a significant level is broken a change of trend is highly possible. However prices are testing the 4/1 level now. Let's see if prices are able to break this level and proceed to 8/1 level.
Join us on Telegram and PM us to learn more and request for the stocks you need reviewing for FREE. We also post other extra contents that we do not share here, which includes weekly recap and weekly analysis.
Telegram : https://t.me/thechartstory
In this fast-moving digital world, we get information in a few clicks.
However, we rarely get first-hand information and more often we get misleading news.
Investing in stocks today is very different from the past, but one thing hasn't changed - to study about a stock before putting money in.
A stock chart contains data that is publicly available and accurate by itself. By having certainty in data quality, we can comfortably study charts and make investment judgements.
At Chart Story, we believe stock prices move for a reason. Our objective is to share what we believe.
More articles on KLSE Stocks Review
YTL (0025) The Story behind the Chart of YTL CORPORATION BERHAD
Created by ChartStory72 | May 05, 2022
FRONTKN (0128) The Story behind the Chart of FRONTKEN CORP BHD
Created by ChartStory72 | Jan 18, 2022
ANNJOO (6556) The Story behind the Chart of ANN JOO RESOURCES BHD
Created by ChartStory72 | Jan 17, 2022
EVERGRN (5101) The Story behind the Chart of EVERGREEN FIBREBOARD BERHAD
Created by ChartStory72 | Jan 11, 2022
TEXCYCL (0089) The Story behind the Chart of TEX CYCLE TECHNOLOGY (M) BERHAD
Created by ChartStory72 | Jan 10, 2022
Wong (7050) The Story behind the Chart of WONG ENGINEERING CORPORATION BERHAD
Created by ChartStory72 | Jan 03, 2022
TOPGLOV ( 7113) The Story behind the Chart of TOP GLOVE CORP BHD
Created by ChartStory72 | Dec 06, 2021
Discussions
Be the first to like this. Showing 0 of 0 comments
Post a Comment
Featured Posts
New Update. Discover investment communities that resonate with your ideas
One App To Trade Malaysia & US Stock With 0* Commission
Apps


Top Articles
1
2
save malaysia!
4
BFM Podcast
5
BFM Podcast
6
BFM Podcast
7
Good Articles to Share
8
Good Articles to Share
#
Stock
Score
Daily Stocks
Stock Name
Last
Change
Volume
Stock Name
Last
Change
Volume
Stock Name
Last
Change
Volume
MQ Trading Signals
Stock
Time
Signal
Duration
No trading signals available.
Stock
Time
Signal
Duration
No trading signals available.
Featured Advertisers / Partners


Ride The Bull Short The Bear
CS Tan
4.9 / 5.0
This book is the result of the author's many years of experience and observation throughout his 26 years in the stockbroking industry. It was written for general public to learn to invest based on facts and not on fantasies or hearsay....