


KLSE Stocks Review
FRONTKN (0128) The Story behind the Chart of FRONTKEN CORP BHD

ChartStory72
Publish date: Tue, 18 Jan 2022, 01:52 PM
ChartStory72
0 211
We post FREE chart reviews on KLSE daily Top Gainers and Most Actively Traded Counters. We are also giving out free reviews for our subs as well. Come join us on Telegram and PM us to learn more and request for the stocks you need reviewing for FREE.
Facebook : https://www.facebook.com/thechartstory
Telegram : https://t.me/thechartstory
Facebook : https://www.facebook.com/thechartstory
Telegram : https://t.me/thechartstory
Frontkn 0128
Normal TA VS Fibonacci TA
Normal TA
Let's do something different today as everyday you see post all about Fibonacci. Today I am going to do a comparison between Fibonnaci TA and Normal TA. To access the remaining post you can follow my Telegram Channel, it is all inside my Channel. Link is at the Bottom.
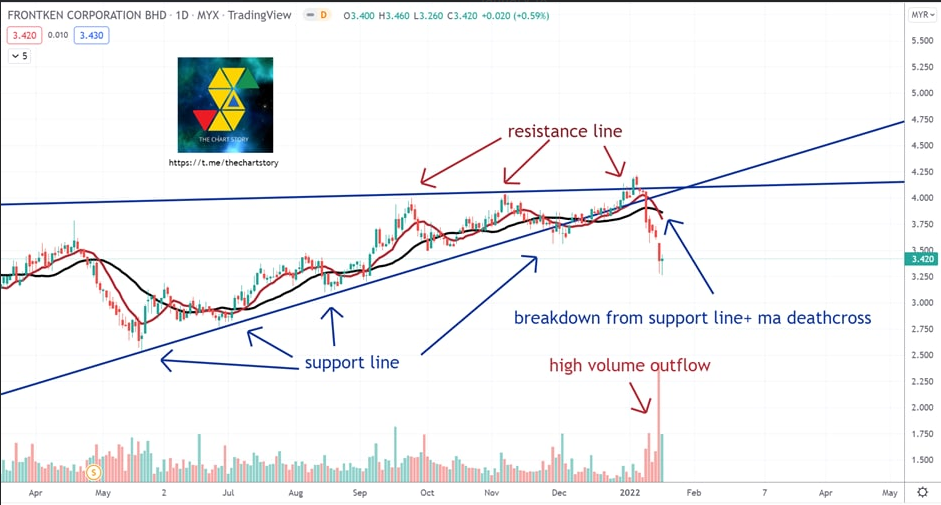
Overall prices is in a pre-breakout/breakdown type of movement. Why? Let’s look at the chart.
First, notice that there is a support trendline supporting the prices. Prices rebounded off whenever it touches the line. Thus, a higher low is forming constantly. On the other hand, there is no higher high forming. A strong resistance line is preventing prices from trending higher. Also, The Moving Average (MAs) are starting to flat out, which is a sign of ranging.
The bad news is, prices had finally brokedown from the support line recently. The scenario is getting worse on last Friday, which is a gap down red candle followed by high volume. High volume outflow at the peak is a sign of bankers leaving. Also, MA deathcross had formed on the same day.
Come join us on Telegram and PM us to learn more and request for the stocks you need reviewing for FREE. We also post other extra contents that we do not share here, which includes weekly recap and weekly analysis.
Telegram : https://t.me/thechartstory
In this fast-moving digital world, we get information in a few clicks.
However, we rarely get first-hand information and more often we get misleading news.
Investing in stocks today is very different from the past, but one thing hasn't changed - to study about a stock before putting money in.
A stock chart contains data that is publicly available and accurate by itself. By having certainty in data quality, we can comfortably study charts and make investment judgements.
More articles on KLSE Stocks Review
YTL (0025) The Story behind the Chart of YTL CORPORATION BERHAD
Created by ChartStory72 | May 05, 2022
DSONIC (5216) The Story behind the Chart of DATASONIC GROUP BERHAD
Created by ChartStory72 | Apr 18, 2022
ANNJOO (6556) The Story behind the Chart of ANN JOO RESOURCES BHD
Created by ChartStory72 | Jan 17, 2022
EVERGRN (5101) The Story behind the Chart of EVERGREEN FIBREBOARD BERHAD
Created by ChartStory72 | Jan 11, 2022
TEXCYCL (0089) The Story behind the Chart of TEX CYCLE TECHNOLOGY (M) BERHAD
Created by ChartStory72 | Jan 10, 2022
Wong (7050) The Story behind the Chart of WONG ENGINEERING CORPORATION BERHAD
Created by ChartStory72 | Jan 03, 2022
TOPGLOV ( 7113) The Story behind the Chart of TOP GLOVE CORP BHD
Created by ChartStory72 | Dec 06, 2021
Discussions
Be the first to like this. Showing 0 of 0 comments
Post a Comment
Featured Posts
Introducing MY's First IPO Fund for Sophisticated Investors!
New Update. Discover investment communities that resonate with your ideas
M & A Value Partners IPO Equity Fund has been launched - Targeted 13% Return p.a
Latest Videos

.png)

Apps


Top Articles
1
Mercury Securities Research
3
4
save malaysia!
5
BFM Podcast
7
BFM Podcast
8
BFM Podcast
#
Stock
Score
Daily Stocks
Stock Name
Last
Change
Volume
Stock Name
Last
Change
Volume
Stock Name
Last
Change
Volume
MQ Trading Signals
Stock
Time
Signal
Duration
No trading signals available.
Stock
Time
Signal
Duration
No trading signals available.
Featured Advertisers / Partners


Ride The Bull Short The Bear
CS Tan
4.9 / 5.0
This book is the result of the author's many years of experience and observation throughout his 26 years in the stockbroking industry. It was written for general public to learn to invest based on facts and not on fantasies or hearsay....