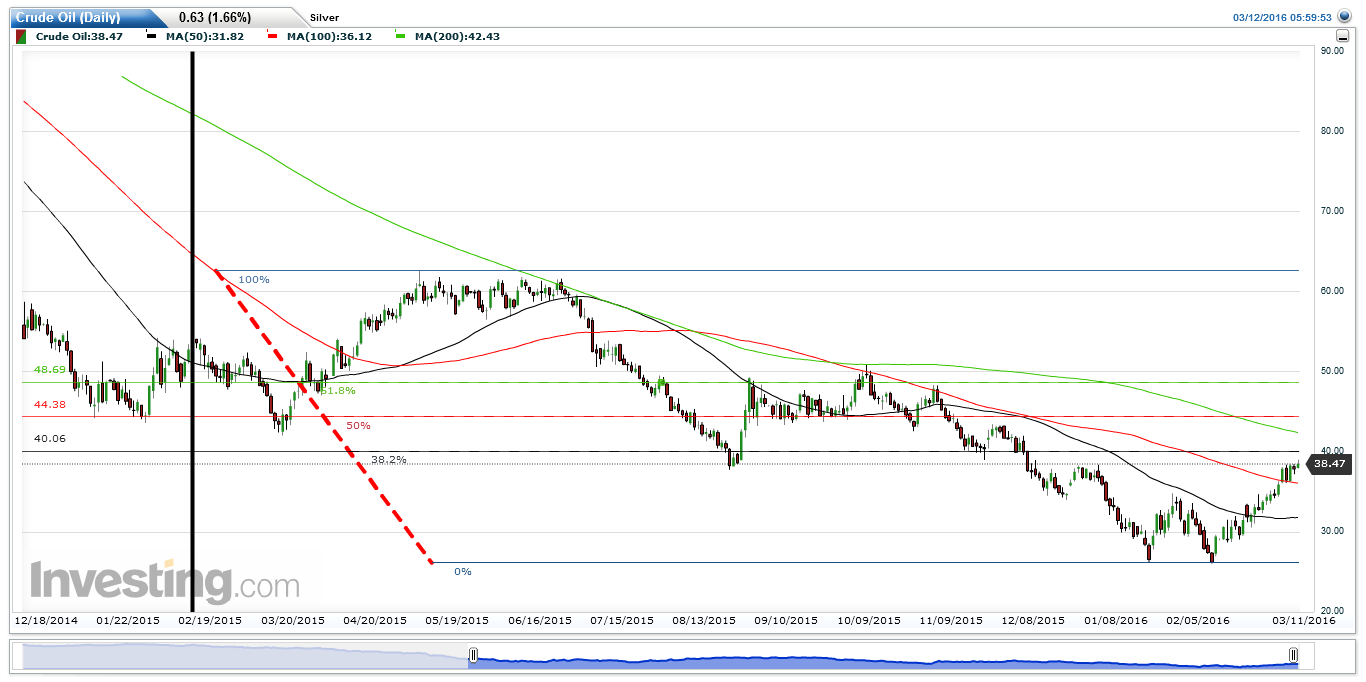
This is still going....
N00b
Publish date: Sat, 12 Mar 2016, 04:12 PM
Right click and then click "View Image" for full size.

More articles on N00b
Discussions
First the 10D MA crossed the 20D MA, then the 20D MA crossed the 50D MA, finally the 10D MA crossed the 100D MA on Friday.
2016-03-12 17:16
As you can see here, http://c3352932.r32.cf0.rackcdn.com/comments_images/145777405016557.jpg
2016-03-12 17:22
I think there is a misunderstanding among us, from the second graph you show me, do you think there is a bullish market in future? So do i. Because the time of downtrend is longer right? i think you mean downtrend is still going on. Maybe next time you can add some words on it compare to just a graph. :)
2016-03-12 18:14
Just imagine Usd fed interest rate 0.25 % , ECB 0%. BoJ 0% -> -ve . Swiss bank 0% . Oil very cheap 40 usd. Inflation 2%===> why would the world stock market crash? Most company should be be able to produce good profit. Those debt by o n g could be rebundled with cheaper rate n given time . Become non issue as oil now above 40. Commodities price has reach bottomed . Deflation that bust the market .. Then where to park the cash ?.. My common sense tell me the cash will start chasing stock again ... R u ready. For last lap for hyper bull. Kikiki
2016-03-12 21:54
@somchik I agree with you.
S&P500 up 212 points (+11.7%) in 21 trading sessions.
WTI Crude Oil up $12.45 / bbl (+47.7%) over the same exact period.
2016-03-12 22:17
100% agree.
Posted by somchik > Mar 12, 2016 09:39 PM | Report Abuse
Remind me of march 2009 ..... Kikiki
2016-03-12 22:24


Short90
not really isnt it? it rally from double bottom, will it became totally became a bull market when the price break the neckline and hold on which is the price when 1/8/16?
2016-03-12 16:42