SCGM higher lows continue
Nott_Invest
Publish date: Sun, 31 Oct 2021, 05:47 PM
SCGM
Sector: Industrial products/ Packaging materials
Analyzed on 31/10/2021

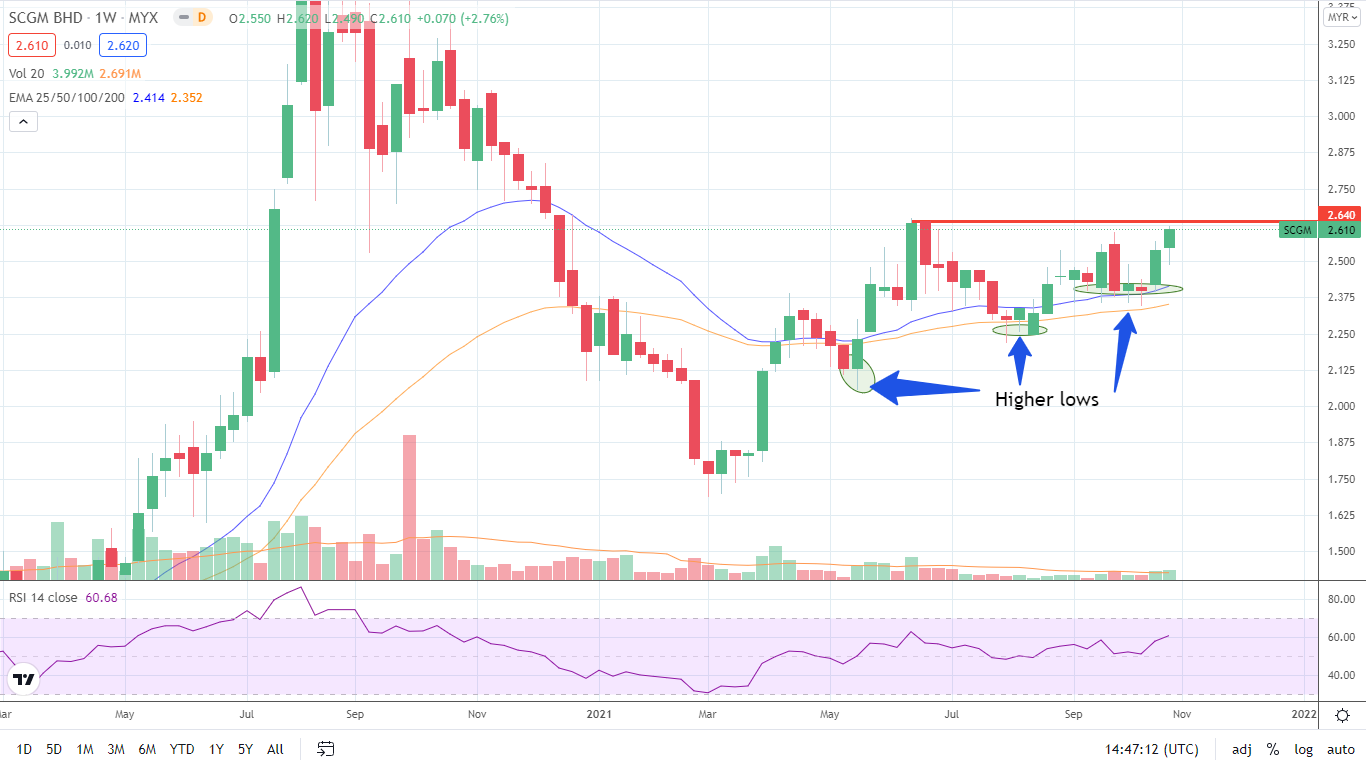
This is the SCGM weekly chart. Since SCGM found support at RM1.75 in March, the chart has been on the road of steady recovery with visible higher lows forming. SCGM is currently trading at RM2.61, with immediate support at EMA25/50 while immediate resistance at RM2.64. Note that both EMA25 and EMA50 are sloping upwards showing that SCGM is currently on a mid-term uptrend. However, the weekly traded volume is rather low as compared to previous.
As SCGM is trading near resistance, investors who are interested may need to either wait for breakout confirmation or retrace to EMA25/50 supports.
Reason to Monitor: Potential Breakout
--------------------------------------------------------
Follow our FB and telegram channel for more investing and trading analysis. Share it out to your friends and family!
TELEGRAM :https://t.me/nottinvest
FB PAGE :https://fb.com/NottInvest
--------------------------------------------------------
Cheers
NOTT INVEST
Disclaimer:
This content by NOTT INVEST, is in no way a solicitation or offer to buy or sell securities or investment advisory services.
Readers should always seek the advice of an appropriately qualified professional and perform due diligence before making any investment decisions.
We shall not be liable for any errors or inaccuracies, regardless of cause.


