[TRV] Financial Statement Analysis for PPHB
TRV Stock Analyzer
Publish date: Wed, 14 Mar 2018, 10:03 AM
Public Packages Holdings Berhad (“PPHB”) and its subsidiaries are primarily focused on the production and sale of paper packaging products. Over the years, the Group has extended its operations from manufacturing of corrugated carton to 4key divisions:
- Carton
- Offset Printing
- Paper Products
- Property Investment
The Group has established 7 manufacturing plants and two 2 sales offices to better service the increasing customer base. The plants are set up strategically at Nibong Tebal, Kulim, Prai, Bayan Lepas and Shah Alam to provide for customers of different locations. The various plants also enable cost savings in transportation, effectively reducing cost of sales. Sales offices are set up in Kuala Lumpur and Singapore.
To better cater for customers’ needs, the Group provides customised solutions such as graphic and structural design as well as a full range of supply chain activities from planning, execution and control of material management, to storage, order processing and fulfilment.
Financial Statement Analysis for PPHB
Above is the 5 FY simplified financial statements for PPHB. In a glace, we can see that the company is making profit for the last 5 FY with positive operating cash flow and free cash flow (highlighted in green).
In the balance sheet, PPHB is a net cash company with cash more than its total debt.
We will go into each of the financial statement below.
To see the complete financial statements, financial ratios and 7 valuation methods on PPHB. Click on the link below:
Income Statement for PPHB
Revenue growth for PPHB has nothing to shout about. For the past 10 FY, revenue growth at a CAGR of 1.4%. For the past 5FY and 3FY, it grew at CAGR of 4.5% and 4.1% respectively.
In term of operating profit, for the past 10FY, 5FY and 3FY, it grew at a much higher rate at 14%, 4.8% and 13.9% respectively.
The bottom line (net profit) grew at even higher rate at 15.5%, 3.8% and 16.5% for the past 3Fy, 5FY and 10FY respectively.
The growth is achieved through operating and net margin expansion which can be seen in the line chart below.
Click to enlarge
Cash Flow Statement for PPHB
Operating cash flow grows in tandem with net profit. For the past 10FY, PPHB has been generating positive operating cash flow and positive FCF.
In term of CAPEX, we can see a substantial jump in CAPEX for year 2016.
In FY 2016, PPHB invested RM2.6 million in factory building expansion. This expansion allows the company to upgrade its operating facilities, boosting production and storage capacities. It also caters for new equipment purchased, further augmenting PPHB’s ability to provide total packaging solutions. Machineries totalling RM10.89 million were also acquired throughout the year with the aim to expand the market share. Progressive investments were arranged for the machineries and will be completed in 2017. With huge investment in machinery and building expansion, we hope to investment may translate in to better earnings in FY2018.
Next, we look at earning quality by comparing net profit to operating cash flow. With this we can see how much the net profit in converted to real cash in the company.
The operating cash flow (Light Brown Bar) is higher than net profit (Blue Bar) in all the last 10 FY except for year 2010. PPHB also has been generating good free cash flow (Green Bar) for the past 5FY.
Balance Sheet for PPHB
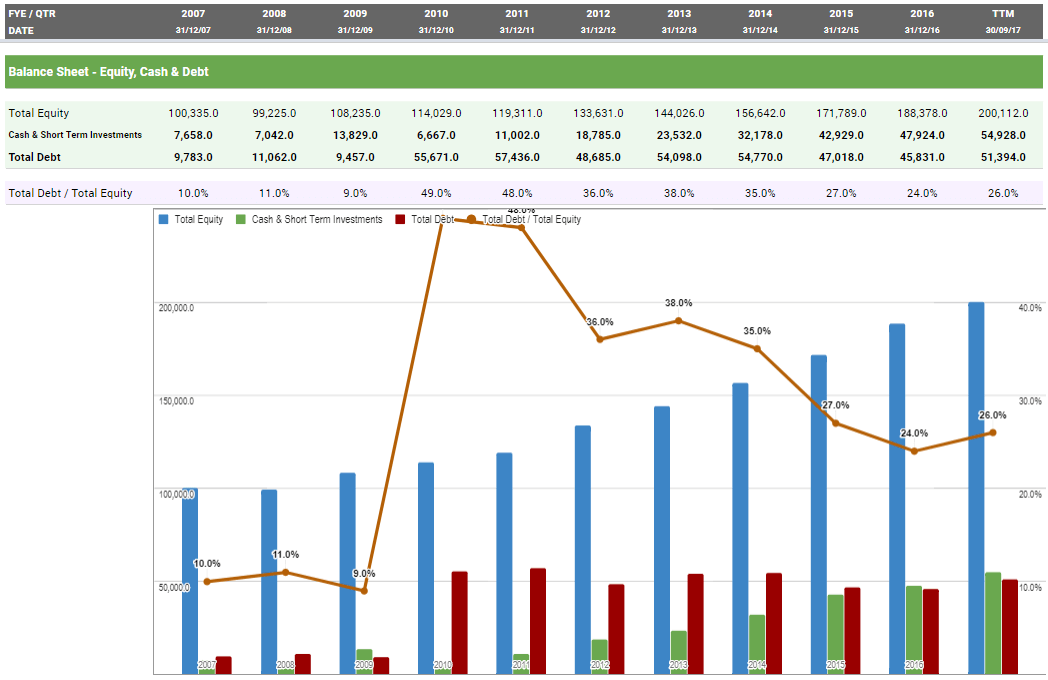
A look into PPHB’s balance sheet shows that the company able to increase the cash balance (Green Bar) over the last 10FY. Debt level stays relatively stable at around 50mil. Since FY 2016, the company has turned into a net cash company – cash level (Green Bar) is higher than debt (Red Bar).
Current debt to equity ratio (line chart) is at 26% - a very comfortable level.
ROE, ROIC and Earning Yield
The chart below shows PPHB’s ROE (Light Green Bar), ROIC (Dark Green Bar) and Earning Yield (Purple Bar).
Currently PPHB gives a yield of 22% and ROIC of 11%.
We will look more on PPHB financial ratios next.
To see the complete financial statements, financial ratios and 7 valuation methods on PPHB. Click on the link below:
--
The TRV Analyzer is an all-in-one analysis and valuation tool that will automatically load financial data, calculate and value the stock!
Website - http://www.TRVanalyzer.com
Facebook - https://fb.me/TRVanalyzer
Messenger - https://m.me/TRVanalyzer
E-Mail - hello@TRVanalyzer.com
Related Stocks
| Chart | Stock Name | Last | Change | Volume |
|---|
More articles on TRV Stock Analyzer
Created by TRV Stock Analyzer | May 24, 2022
Created by TRV Stock Analyzer | Feb 28, 2021
Created by TRV Stock Analyzer | Jan 11, 2021
Created by TRV Stock Analyzer | Dec 08, 2020
Created by TRV Stock Analyzer | Oct 21, 2020
Created by TRV Stock Analyzer | Oct 05, 2020
Created by TRV Stock Analyzer | Sep 13, 2020


stteck
thanks for the chart, its simple and nice for reading
2018-03-14 12:12