


TRV Stock Analyzer
[TRV] Reverse Discounted Cash Flow (RDCF) of Nestle

TRV Stock Analyzer
Publish date: Fri, 16 Mar 2018, 05:06 PM
TRV Stock Analyzer
0 54
The TRV Analyzer is an all-in-one analysis and valuation tool that will automatically load financial data, calculate and value the stock!
Website - http://www.TRVanalyzer.com
Facebook - https://fb.me/TRVanalyzer
Messenger - https://m.me/TRVanalyzer
E-Mail - hello@TRVanalyzer.com
Website - http://www.TRVanalyzer.com
Facebook - https://fb.me/TRVanalyzer
Messenger - https://m.me/TRVanalyzer
E-Mail - hello@TRVanalyzer.com
Discounted cash flow valuation (DCF) is calculated by using future free cash flow projections and discounts them, using a required discount rate, to arrive at present value estimates. A present value estimate is then used to evaluate the potential for investment. If the value arrived at through DCF analysis is higher than the current stock price with good margin of safety, the opportunity may be a good one.
Reverse DCF
Instead of starting with a given year’s FCF, and then projecting towards an unknown, the purpose of the reverse discounted cash flow is to calculate what growth rate the market is applying to the current stock price.
In other words, by working backwards, you can see whether the implied growth rate by the market is higher or lower than what the company is capable of.
Let’s see how it is actually done.
Reverse DCF Valuation of Nestle (M) Bhd.
Starting point of DCF is free cash flow (FCF). FCF for Nestle is growing each year at a relatively stable rate. You may refer to the chart below (Green Bar):
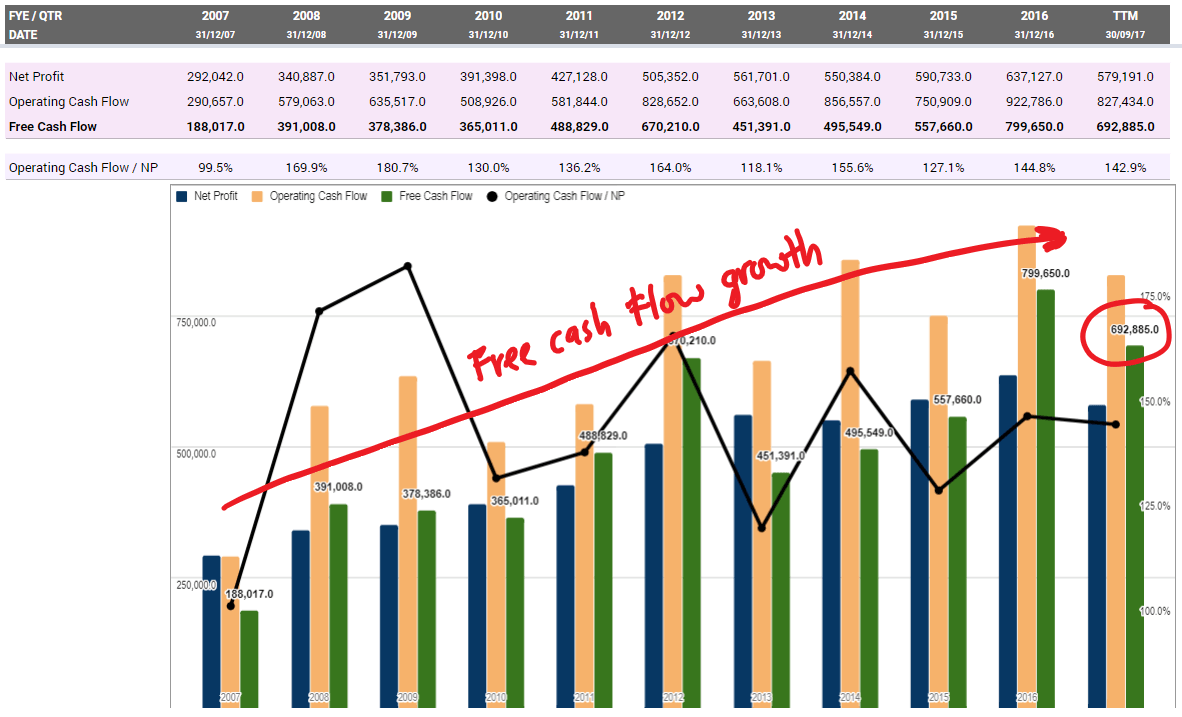
We will start with trailing twelve month (TTM) FCF of 692mil.
We set the discount rate to 8%. The discount rate is obtained from the Valuation Methodology Handbook.

Now that you have the discount rate set to 8%, play around with the growth rate using the DCF model from the TRV Stock Analyzer until you get a value that matches the current price.


On the analyzer, the growth rate has to be set to 24.5% for the reverse DCF valuation to match the current stock price. That means Nestle has to grow 24.5% for the next 5 years and 12.3% for the following 5 years.
Now, let’s look at how Nestle’s FCF growth for the last 10 years.

Since FCF for the majority of companies are volatile, we calculate the growth rates for multiple periods and then calculate the median of all the periods. Median for last 10FY FCF growth is at 9.8%.
With this comparison, you can see that the market is currently pricing Nestle to have quite a high growth. No doubt that market usually price in a premium for staple stock like Nestle but is it too high of a premium when we expect the FCF growth to me more than twice the last 10 years?
--
This reverse discounted cash flow analysis is done with TRV Stock Analyzer. The TRV Analyzer is an all-in-one analysis and valuation tool that will automatically load financial data, calculate and value the stock!
Website - http://www.TRVanalyzer.com
Facebook - https://fb.me/TRVanalyzer
Messenger - https://m.me/TRVanalyzer
E-Mail - hello@TRVanalyzer.com
Related Stocks
| Chart | Stock Name | Last | Change | Volume |
|---|
More articles on TRV Stock Analyzer
[TRV] Picking stocks with Piotroski F score (with 3 new stock ideas)
Created by TRV Stock Analyzer | May 24, 2022
[TRV] SAMCHEM - Leading industrial chemical distributor in Malaysia and South East Asia
Created by TRV Stock Analyzer | Feb 28, 2021
[TRV] SPRITZER – Malaysia’s leading bottled water brand
Created by TRV Stock Analyzer | Jan 11, 2021
[TRV] Quick comparison of Paper & Corrugated Manufacturer in KLSE
Created by TRV Stock Analyzer | Dec 08, 2020
[TRV] Furniture Industry in Malaysia & Vietnam (POHUAT & LIIHEN)
Created by TRV Stock Analyzer | Oct 21, 2020
[TRV] TASCO - Turning-around and potential vaccine logistics play
Created by TRV Stock Analyzer | Oct 05, 2020
[TRV] PADINI - The worst is over. A stock with high yield & high ROIC.
Created by TRV Stock Analyzer | Sep 13, 2020
Featured Posts


Latest Videos


MQ Trading Signals
Time
Signal
Duration
Type
2024-11-22 15:10:00
TURTLE SYSTEM 20
5 Mins
SELL
2024-11-22 15:05:00
TURTLE SYSTEM 20
5 Mins
BUY
2024-11-22 14:50:00
EMA 5
5 Mins
BUY
2024-11-22 14:45:00
ADX
5 Mins
BUY
2024-11-22 14:30:00
ADX
10 Mins
SELL
Apps


Top Articles
1
2
Good Articles to Share
3
4
Koon Yew Yin's Blog
5
BFM Podcast
6
7
BFM Podcast
#
Stock
Score
Daily Stocks
Stock Name
Last
Change
Volume
Stock Name
Last
Change
Volume
Stock Name
Last
Change
Volume
Featured Advertisers / Partners


Ride The Bull Short The Bear
CS Tan
4.9 / 5.0
This book is the result of the author's many years of experience and observation throughout his 26 years in the stockbroking industry. It was written for general public to learn to invest based on facts and not on fantasies or hearsay....
Bruce88
just keep it simple..
2018-03-16 19:45