


UOB Kay Hian Research Articles
Traders' Corner - ML Global (MLG MK)

UOBKayHian
Publish date: Fri, 17 Nov 2017, 04:14 PM
UOBKayHian
0 1,987
An official blog in I3investor to publish research reports provided by UOB Kay Hian research team.
All materials published here are prepared by UOB Kay Hian. For latest offers on UOB Kay Hian trading products and news, please refer to: http://www.utrade.com.my
UOB Kay Hian Securities (M) Sdn Bhd (194990-K)
Hotline:
1800 UTRADE /
1800 88 7233 (Securities)
+6088 235611 (Futures)
Email: contact@utrade.com.my
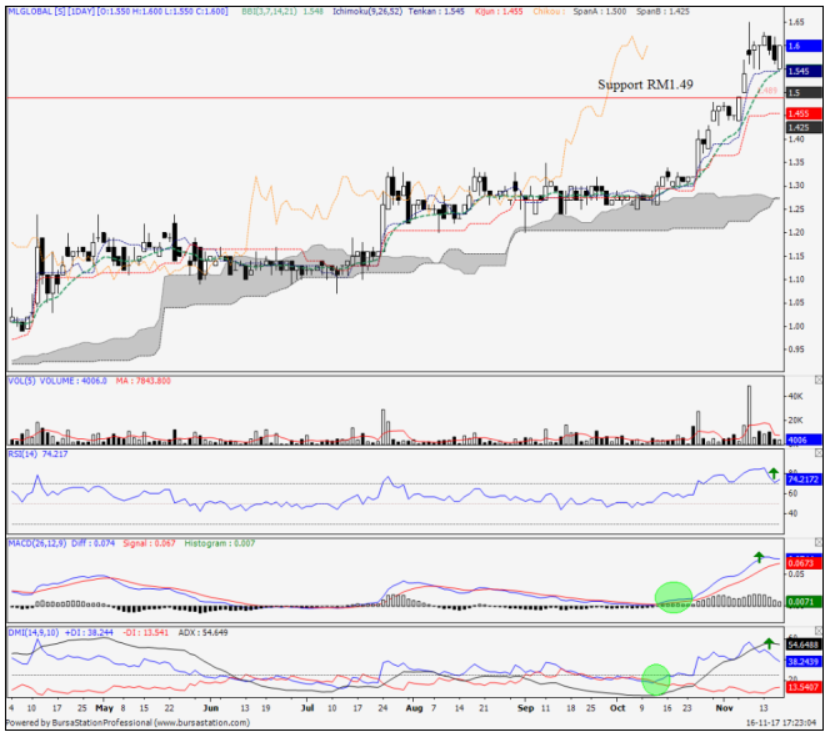
- Technical BUY with +19.4% potential return
- Last price: RM1.60
- Target price: RM1.79, RM1.91
- Support: RM1.49
- Stop-loss: RM1.48
BUY with a target price of RM1.91 and stop-loss at RM1.48. Based on the daily chart, MLG formed higher highs and higher lows that indicate an uptrend. A buying signal is seen as the stock has been trading above the Ichimoku cloud. This is supported by the Heat Wave indicators - the Tenkan-sen line, Kinjun-sen line and Chikao span line - which suggest a bullish signal. An uptick in the RSI suggests buying momentum is set to continue in the near term. Currently, the DMI is showing a bullish crossover to support the upward momentum.
Expected Timeframe: 2 weeks to 2 months
Source: UOB Kay Hian Research - 17 Nov 2017
Related Stocks
| Chart | Stock Name | Last | Change | Volume |
|---|
More articles on UOB Kay Hian Research Articles
IHH Healthcare - 2Q22 Blip as Admissions See An Unequal Recovery
Created by UOBKayHian | Aug 26, 2022
IHH Healthcare - 4Q21 Results Beat Expectations Off Sustained Key Contributions
Created by UOBKayHian | Feb 24, 2022
Top Glove - 1QFY22 Results Weighed by Softened Industry Prospects
Created by UOBKayHian | Dec 13, 2021
Gloves Companies – Malaysia - Glove Manufacturers Deemed Non-Essential Under EMCO
Created by UOBKayHian | Jul 12, 2021
Rubber Gloves – Malaysia - New Coronavirus Sparks Loftier But Justified Valuations
Created by UOBKayHian | Jan 29, 2020
Featured Posts


Latest Videos
.png)


MQ Trading Signals
Time
Signal
Duration
Type
2024-09-26 16:30:00
VOLUME BREAKOUT
30 Mins
BUY
2024-09-26 16:30:00
ADX
5 Mins
SELL
2024-09-26 14:50:00
EMA 5
10 Mins
BUY
2024-09-26 14:30:00
EMA 5
5 Mins
BUY
2024-09-26 14:30:00
ADX
5 Mins
BUY
Apps


Top Articles
1
2
Rockstone Investment
Binastra Corp Bhd – A Promising Investment in Construction in 2025
3
AmInvest Research Reports
4
save malaysia!
5
8
CEO Morning Brief
China Probes Calvin Klein Parent Over Suspected Xinjiang Boycott
#
Stock
Score
Daily Stocks
Stock Name
Last
Change
Volume
Stock Name
Last
Change
Volume
Stock Name
Last
Change
Volume
Featured Advertisers / Partners


Ride The Bull Short The Bear
CS Tan
4.9 / 5.0
This book is the result of the author's many years of experience and observation throughout his 26 years in the stockbroking industry. It was written for general public to learn to invest based on facts and not on fantasies or hearsay....