Technical Analysis - TELEKOM MALAYSIA BERHAD
kltrader
Publish date: Wed, 17 Jul 2024, 07:31 PM

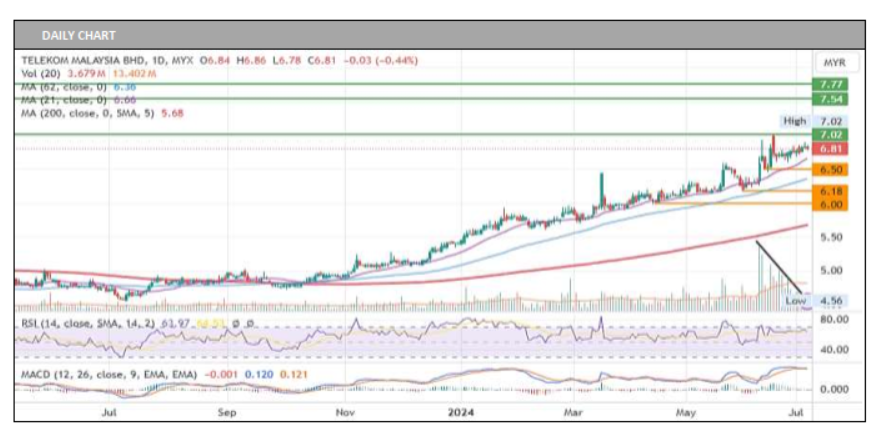
On the daily chart, TELEKOM MALAYSIA BERHAD (TM) is currently displaying a bullish bias, supported by its position above the Moving Averages (MA). The Relative Strength Index (RSI) is above the confirmation level, and a positive reading in the Moving Average Convergence Divergence (MACD) further strengthens the bullish momentum. If this trend persists, TM could potentially reach resistance levels ranging from 7.02 to 7.77. However, despite the intact uptrend, the diminishing volume indicating that the trend’s strength may be fading and hinting at potential changes in direction. In the event of a reversal, TM might test the nearest support level around 6.50. Our research house recommends a BUY call on TM, with a target price of RM7.77.
Source: BIMB Securities Research - 17 Jul 2024
Related Stocks
| Chart | Stock Name | Last | Change | Volume |
|---|
Market Buzz
2025-01-20
TM2025-01-20
TM2025-01-20
TM2025-01-20
TM2025-01-17
TM2025-01-17
TM2025-01-17
TM2025-01-17
TM2025-01-17
TM2025-01-16
TM2025-01-16
TM2025-01-16
TM2025-01-16
TM2025-01-16
TM2025-01-16
TM2025-01-16
TM2025-01-16
TM2025-01-15
TM2025-01-15
TM2025-01-15
TM2025-01-15
TM2025-01-15
TM2025-01-15
TM2025-01-14
TM2025-01-13
TM2025-01-13
TM2025-01-13
TM2025-01-13
TM2025-01-13
TM2025-01-13
TM2025-01-10
TM2025-01-10
TM2025-01-10
TM2025-01-10
TMMore articles on Bimb Research Highlights
Created by kltrader | Jan 13, 2025


