


Candlestick & Breakout Patterns
MAYBANK Long Term Double Bottom Breakout Hitting All Time High

Ming Jong Tey
Publish date: Tue, 04 Apr 2017, 10:03 PM
Ming Jong Tey
0 68
Understand the psychology behind the candlestick & breakout pattern will give you an edge to realize why the market does what it does and anticipate opportunities before they happen!
Get notified on The Next Best Trading & Investing Ideas for free:
Visit ==> http://www.vipplatform.com/lp/ideas/
"Like" FB Page ==> https://www.facebook.com/BursaSGXcandlestick/
"Join" Telegram Channel ==> https://t.me/BursaSGXCandlestick
Get notified on The Next Best Trading & Investing Ideas for free:
Visit ==> http://www.vipplatform.com/lp/ideas/
"Like" FB Page ==> https://www.facebook.com/BursaSGXcandlestick/
"Join" Telegram Channel ==> https://t.me/BursaSGXCandlestick
MAYBANK (1155): Bullish
Pattern: Double Bottom Breakout
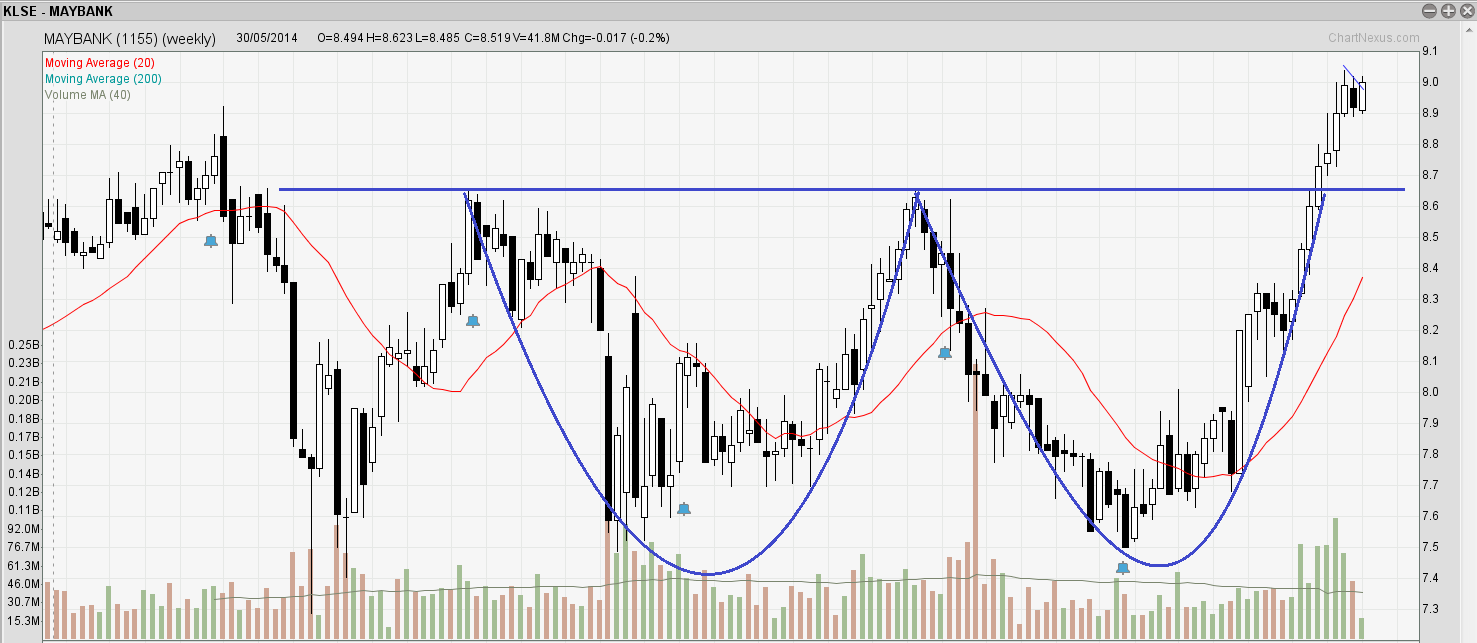
Based on MAYBANK's weekly chart above, we notice a double bottom formed in 2 years and last month MAYBANK broke out the neckline with strong volume.
The projected target prices based on the pattern are 9.38, 9.82 and 10.5.
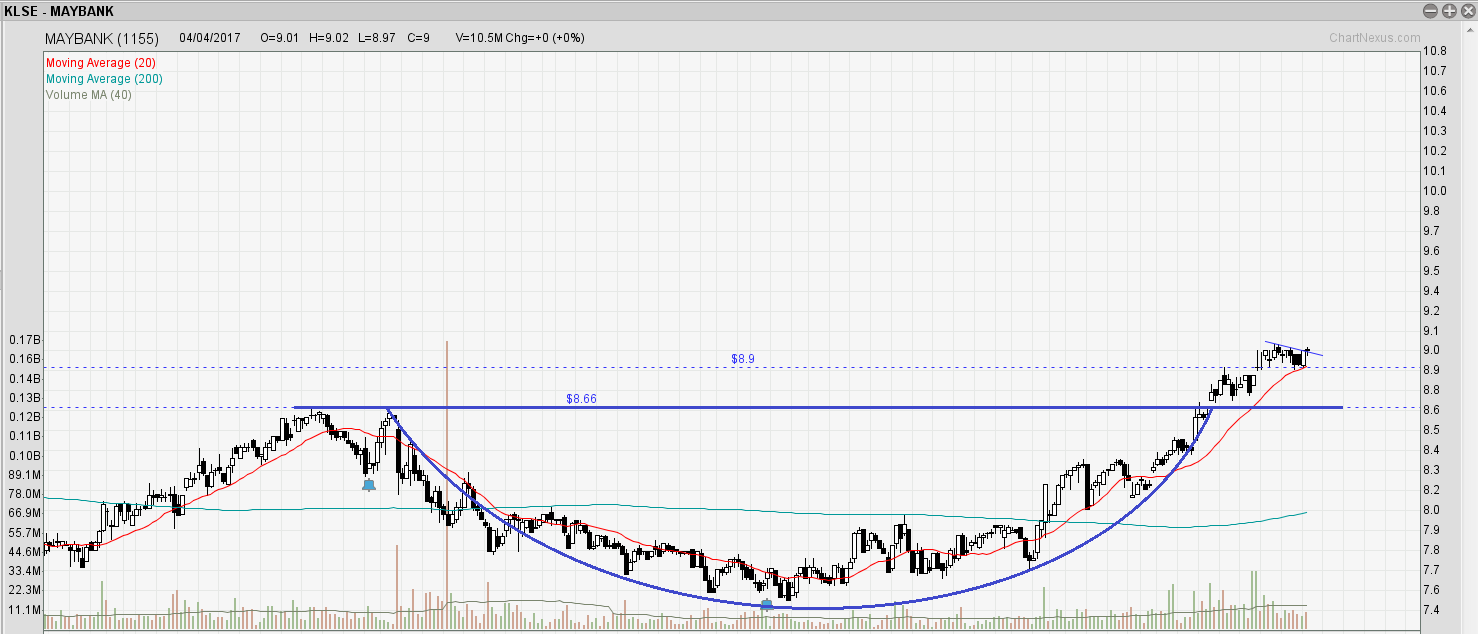
From MAYBANK's daily chart above, after it broke out the neckline, the price has been consolidating in a rectangle and move up nicely. Now, MAYBANK seems to be ripe for picking up the bullish momentum to step into the uncharted territory after 2 weeks of consolidation.
I am bullish on MAYBANK when it stays above 8.50.
Leave me a comment below and let me know what you think. If you have any queries or want to share the next big stock with me, feel free to contact me via my email or FB page below.
Topics That You Do Not Want To Miss
How to determine the "bullishness" of the patterns- https://www.facebook.com/BursaSGXcandlestick/videos/378260995905662/
The Trade Management Technique You Need To Know - http://klse.i3investor.com/blogs/candlestick/114496.jsp
Best Way To Learn To Trade Without A Mentor - http://klse.i3investor.com/blogs/candlestick/113821.jsp
Entry Setup Illustration - http://klse.i3investor.com/blogs/candlestick/113605.jsp
Stop Loss & Safe Trading - http://klse.i3investor.com/blogs/candlestick/113510.jsp
Ultimate Guide For Position Sizing - http://klse.i3investor.com/blogs/candlestick/113061.jsp
Come Up With Trading Ideas & Turn Them Into Investing Ideas - http://klse.i3investor.com/blogs/candlestick/114110.jsp
Cheers,
Ming Jong
Get Update From ==> http://www.vipplatform.com/lp/ideas/
FB Page ==> https://www.facebook.com/BursaSGXcandlestick/
Telegram Channel ==> https://t.me/BursaSGXCandlestick
Contact Via Email ==> ![]()
More articles on Candlestick & Breakout Patterns
IQGROUP Rounding Bottom Breakout With A Beautiful Uptrending Channel
Created by Ming Jong Tey | Jun 29, 2017
RCECAP Rounding Bottom Breakout Plus Trending Up Inside A Channel
Created by Ming Jong Tey | May 25, 2017
PENTA Revisit - Rounding Bottom Breakout In A Long-Term Time Frame
Created by Ming Jong Tey | May 21, 2017
Discussions
3 people like this. Showing 5 of 5 comments
apprentice, Maybe not 70 but 60 is visible when Mayban touch 9.50 when near expiry.
2017-04-21 11:01
Post a Comment
Featured Posts
Introducing MY's First IPO Fund for Sophisticated Investors!
New Update. Discover investment communities that resonate with your ideas
M & A Value Partners IPO Equity Fund has been launched - Targeted 13% Return p.a
Latest Videos
.png)


Apps


Top Articles
1
AmInvest Research Reports
Mynews Holdings - Near Term Positives Priced In. Downgrade to HOLD.
2
CEO Morning Brief
YTL, Related Stocks Slip Amid News Reports on 1BestariNet Investigation
3
Good Articles to Share
5
BFM Podcast
6
BFM Podcast
7
BFM Podcast
8
BFM Podcast
#
Stock
Score
Daily Stocks
Stock Name
Last
Change
Volume
Stock Name
Last
Change
Volume
Stock Name
Last
Change
Volume
MQ Trading Signals
Stock
Time
Signal
Duration
No trading signals available.
Stock
Time
Signal
Duration
No trading signals available.
Featured Advertisers / Partners


Ride The Bull Short The Bear
CS Tan
4.9 / 5.0
This book is the result of the author's many years of experience and observation throughout his 26 years in the stockbroking industry. It was written for general public to learn to invest based on facts and not on fantasies or hearsay....
Blacksails
Buy Maybank-C24 before it went to 70 when it's still discount @30 Potential loss 10, potential gain 40. Do your own risk calculation. Buy at your own risk.
2017-04-04 23:42