IQGROUP Rounding Bottom Breakout With A Beautiful Uptrending Channel
Ming Jong Tey
Publish date: Thu, 29 Jun 2017, 05:31 PM
IQGROUP (5107): Bullish
Pattern: Rounding Bottom Breakout Plus Uptrending Channel

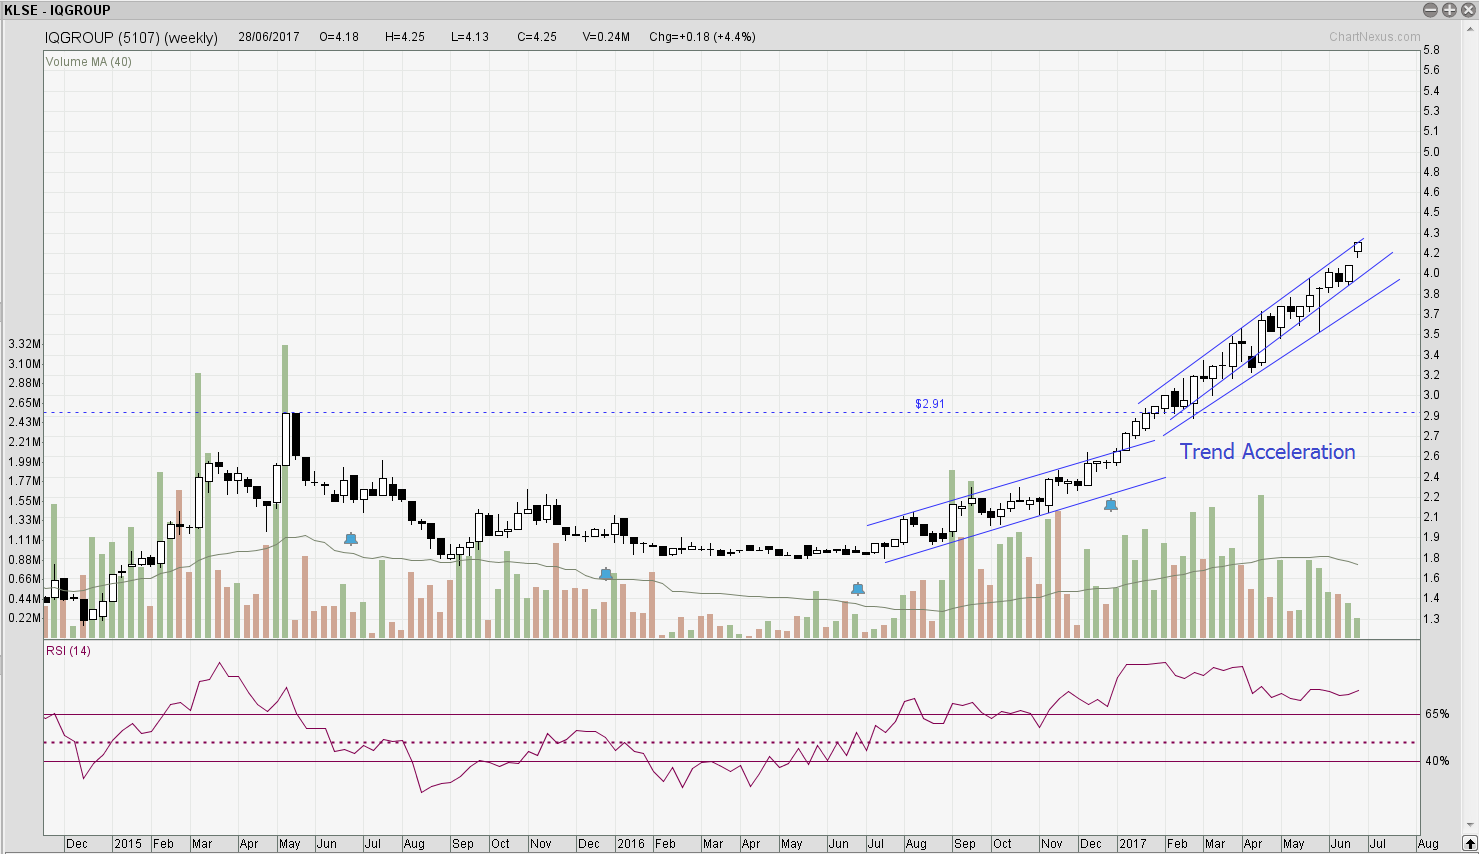
Based on IQGROUP's weekly chart above, we can observe that the bullish momentum of IQGROUP accelerated once it broke out from the first channel from July till Dec 2016. Subsequently, it trends nicely within the second channel with a higher degree gradient (i.e. trend acceleration).

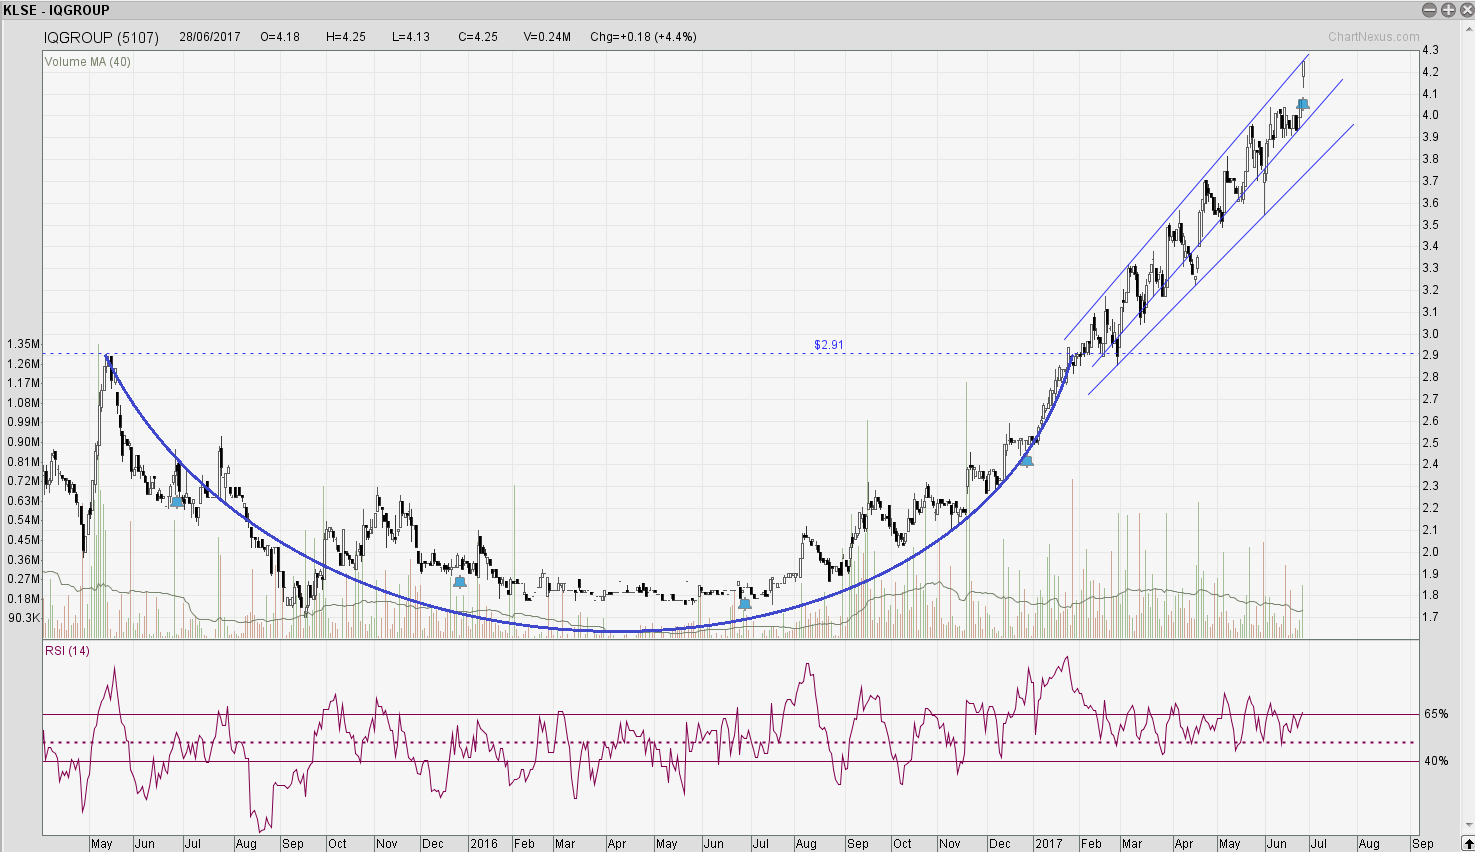
As shown in IQGROUP's daily chart above, it formed a rounding bottom, broke out and did a retest of the neckline before going to trend upwards within the channel.
Based on IQGROUP's characteristics, a buy on dip could form a good trading plan.
It is also worth to note that IQGROUP gapped up yesterday with a strong bullish candle and might break out from the channel. Should it break out, we might see trend acceleration like it did as shown in IQGROUP's weekly chart, which will be become a parabolic uptrend.
Based on the rounding bottom pattern, the projected target price are 4.07 (already hit), 4.8 and 5.23.
I maintain my bullish view on IQGROUP as long as it is trading above 3.50.
Leave me a comment below and let me know what you think. If you have any queries or want to share the next big stock with me, feel free to contact me via my email or FB page below.
Topics That You Do Not Want To Miss
How to determine the "bullishness" of the patterns- https://www.facebook.com/BursaSGXcandlestick/videos/378260995905662/
The Trade Management Technique You Need To Know - http://klse.i3investor.com/blogs/candlestick/114496.jsp
Best Way To Learn To Trade Without A Mentor - http://klse.i3investor.com/blogs/candlestick/113821.jsp
Entry Setup Illustration - http://klse.i3investor.com/blogs/candlestick/113605.jsp
Stop Loss & Safe Trading - http://klse.i3investor.com/blogs/candlestick/113510.jsp
Ultimate Guide For Position Sizing - http://klse.i3investor.com/blogs/candlestick/113061.jsp
Come Up With Trading Ideas & Turn Them Into Investing Ideas - http://klse.i3investor.com/blogs/candlestick/114110.jsp
Cheers,
Ming Jong
Get Update From ==> http://www.vipplatform.com/lp/ideas/
FB Page ==> https://www.facebook.com/BursaSGXcandlestick/
Telegram Channel ==> https://t.me/BursaSGXCandlestick
Contact Via Email ==> ![]()
Related Stocks
| Chart | Stock Name | Last | Change | Volume |
|---|
Market Buzz
More articles on Candlestick & Breakout Patterns
Created by Ming Jong Tey | May 25, 2017
Created by Ming Jong Tey | May 21, 2017
Discussions
@daisaku It is based on the projection of the depth of the rounding bottom together with FIBO. Refer to this chart for better illustration -- https://www.facebook.com/BursaSGXcandlestick/photos/a.289668618098234.1073741828.282808655450897/373020929763002/?type=3
2017-06-29 18:48
Dear Ming jong i suggest u consider to set up a telegram group. Easier to exchange ideas
2017-06-29 20:28
@shareinvestor88 thanks for your suggestion...I find it time-consuming to manage a group and hard to keep track of the respond...Feel free to drop me an email.
2017-06-29 21:08


daisaku
Would you mind elaborate more how're target prices deduced ?
2017-06-29 18:35