If success for a farmer is measured by his or her harvest, success in a business, from an investors' standpoint, should be measured by its capacity to return cash flows for its owners. That is not belittling the intermediate steps needed to get there, since to be able to generate these cash flows, businesses have to find ways to treat employees well, satisfy customers and leave society at ease with their existence, but the end game does not change. That is why I find it surprising that when companies pay dividends, or worse still, buy back stock, there are so many who seem to view them as failures. Perhaps, that flows from the misguided view that reinvesting cash is good, not just for the company but also for the economy, because it creates growth and returning cash is bad, because it is somehow wasted, both flawed arguments. A company that reinvests cash in a bad business is destroying value, not adding to it, and as we saw in my post on excess returns, a preponderance of companies globally earn less than their costs of capital. Cash that is returned is not lost to the economy, but much of it is reinvested back into other businesses that often have much better investment opportunities. That said, the way companies determine how much to return to shareholders, either as dividends or in the form of buybacks, is grounded in inertia and me-tooism.
Dividends' Place in the Big Picture
In my corporate finance classes, I present what I term the big picture of corporate finance and the first principles that should govern how a business is run:

If you view dividends as residual cash flows, which is what they should be, the sequence that leads to dividends is simple. Every business should start by looking at its investment opportunities first, then finding a financing mix that minimizes its hurdle rate and then based upon its investment and financing choices, determine how much to pay out as dividends.
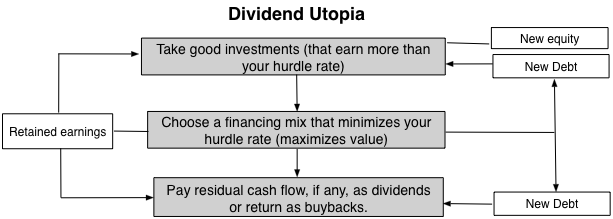
Note that this sequence holds only if capital markets (debt and equity) remain open, accessible and fairly priced, and companies have no self imposed constraints on raising capital or dividend payments. Those are clearly big and perhaps unrealistic assumptions for most companies, especially so for small firms and companies in emerging market, and that is why I have titled it Dividend Utopia. In the real world, there are multiple constraints, some external and some internal, that change the sequence.
- Capital markets are not always open and accessible: In utopian corporate finance, a company with a good investment opportunity, i.e., one that earns more than the cost of capital can always raise capital from equity or debt market, quickly, at a fair price and with little or no issuance costs. In the real world, capital markets are not that accommodating. Raising capital can be a costly exercise, investors may under price your debt and equity, and the process can take time. It should come as no surprise then that if a company pays too much in dividends in this setting, it will find itself rejecting good investments.
- Banks may be the only lending option: For many companies, the only option when it comes to borrowing money is to go to a bank, and to the extent that banks face their own constraints on lending, companies may be unable to borrow at what they perceive to be fair rates. This will effectively play out in both investing and financing decisions.
- Dividends are sticky: If there is one word that characterizes dividend policy around the world, it is that it is "sticky". Companies, once committed to paying dividends, are unwilling to either cut or stop paying dividends, for fear of market punishment. That stickiness translates into companies continuing to pay dividends, even as earnings collapse and/or investment opportunities expand.
In a world with these constraints, dividends are no longer a residual cash flow, determined by choices you make on investments and financing, but a determinative cash flow, driving investment and financing decisions. If you add the desire of companies to pay dividends similar to those that they have in the past (inertia) and to be like the rest of the sector (me-too-ism) and irrational fears of dilution and debt, you have the makings of dysfunctional dividends.
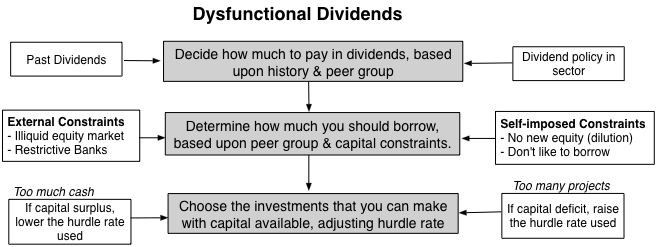
In this circular universe, by putting dividend and financing decisions first, companies can end up with too much or too little capital available for projects, and in this dysfunctional universe, they adjust discount rates to make investment demand equate to supply. I never cease to be surprised by companies that claim to use hurdle rates as high as 20% and as low as 3%, both numbers that are out of the range of any reasonable cost of capital computation. In extreme cases, you can have dividend insanity, where companies that are losing money and are already over levered borrow even more money to pay dividends, making their cash flow deficits worse, leading to more losses, more debt and more dividends.
If dividends are, in fact, a residual cash flow, estimating how much you can afford to pay is a simple exercise of starting with the cash flows from operations that equity investors generate and netting out investment cash flows and cash flows to and from debt.

In effect, everything you need to estimate this potential dividend or free cash flow to equity (FCFE) should be in the statement of cash flows for a firm. This measure of potential dividends can be utilized, with my corporate life cycle framework, to frame how dividend policy should evolve over a company's life, if it were truly residual.

Note that the FCFE is the cash that is available for return and that companies can choose to return that cash as traditional dividends or in buybacks. If they choose not to do so, the cash will accumulate as a cash balance at the company.
The Compressed Life Cycle and Consequences
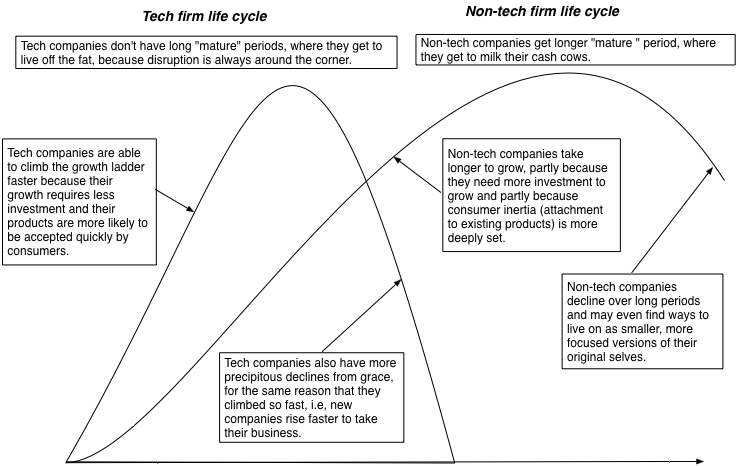
In this post from a while back, I argued that as we have shifted from the smoke stack and manufacturing sectors of the last century to the technology and service companies of the modern era, life cycles have compressed, creating challenges for both managers and investors.
That compressed life cycle has consequences for both how much companies can return to shareholders and in what form:
- Once mature, companies will return more cash over shorter periods: The intensity of both the growth and the decline phases, with compressed life cycles, will mean that companies will become larger much more quickly than they used to, both in terms of revenues and earnings, but once they hit the "growth wall", they will find investment opportunities shrinking much faster, thus allowing for more cash to be returned over shorter time periods.
- Those cash returns will be more likely to be in buybacks or special dividends, not regular dividends: The sweet spot for conventional dividends is the mature phase, where companies get to enjoy their dominance and rest on their competitive advantages, with large and predictable earnings. With the life cycle shortening and becoming more intense, this sweet spot period has become much briefer. Think of how little time Yahoo! and Blackberry got to enjoy being mature companies, before decline kicked in. Even the rare tech companies, like Microsoft and Apple, that have managed to extend their mature phases have to reinvent themselves to keep generating their earnings, making these earnings more uncertain. Paying large regular dividends in this setting is foolhardy, since investors expect you to keep paying them, in good times and bad.
- Companies that fight aging will see bigger cash build ups: No company likes to age, and it should not come as a surprise that many tech companies fight the turn in their life cycles, deluding themselves into believing that a rebirth is around the corner and not returning cash., even as free cash flows to equity turn positive. At these companies, cash balances quickly balloon, attracting activist investors.
In short, much of what managers and investors know or expect to see in dividend policy reflects a different age and time. It should come as no surprise that older investors, especially ones that grew up with Graham and Dodd as their investing bible find this new world bewildering. I can offer little consolation, since globalization and disruption will only make things more unstable and less suited to paying large, stable dividends.
Cash Return Numbers
Having laid the foundations for understanding the shifts that are occurring in dividend policy, we have a structure for putting the numbers that we will see in this section in perspective. I will start this section by looking at regular dividends and conventional measures of these dividends (dividend yield and payout ratios) but then expand cash return to include stock buybacks and how metrics that capture its magnitude and close by looking at cash balances at companies.
Regular Dividends
There are two widely used measures of dividends paid. One is to scale the dividends to the earnings, resulting in a payout ratio. That number, to the extent that you trust accounting income and dividends are the only way of returning cash to stockholders plays a dual role, telling cash-hungry investors how much the company will pay out to them, and growth-seeking investors how much is being put back into the business, to generate future growth (with a retention ratio = 1 - payout ratio). The picture below captures the distribution of payout ratios across the globe, with regional sub-group numbers embedded in a table in the picture:
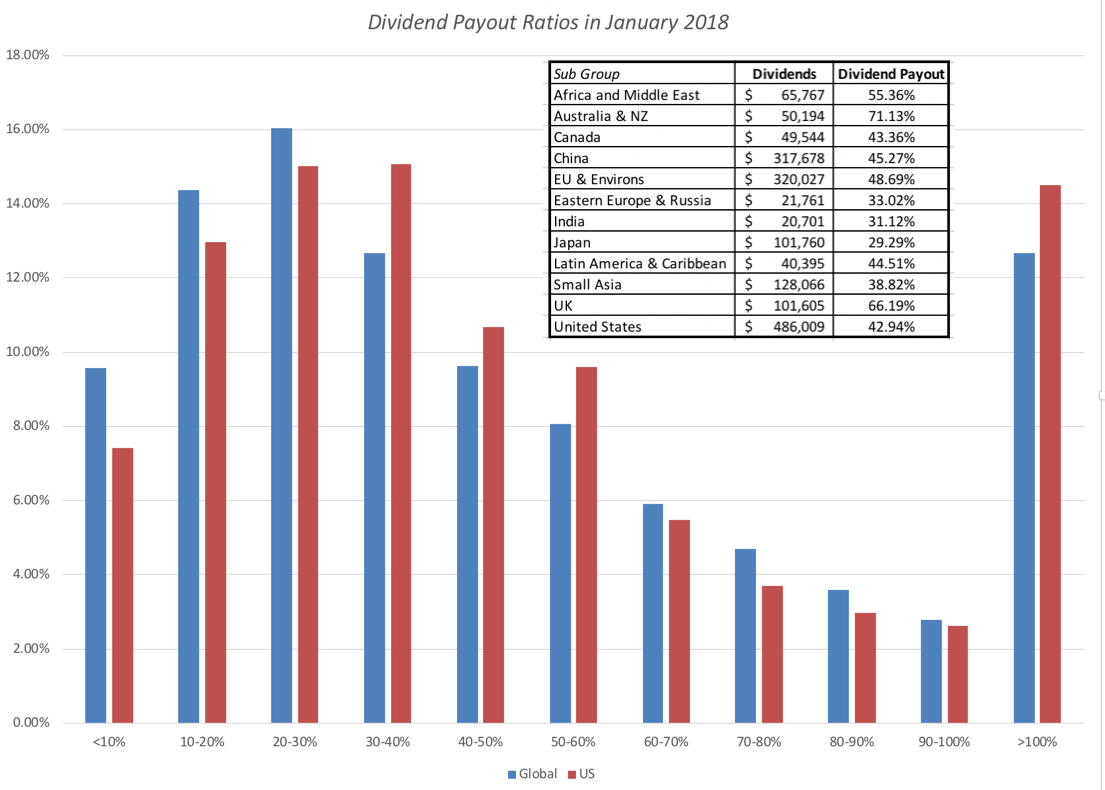
Note that the payout ratio cannot be computed for companies that pay dividends, while losing money, and that it can be greater than 100% for companies that pay out more than their earnings. Japan has the lowest dividend payout ratio, across regions, a surprise given the lack of growth in the Japanese economy., and Australian companies pay out the higher percentage of their earnings in dividends.
The other measure of dividends paid is the dividend yield, obtained by dividing dividends by the market capitalization. This captures the dividend component of expected return on equities, with the balance coming from expected price appreciation. To the extent that dividends are sticky and thus more likely to continue over time, stocks with higher dividend yields have been viewed as safer investments by old time value investors. The picture below has the distribution of dividend yields for global companies at the start of 2018, with regional sub-group numbers embedded:
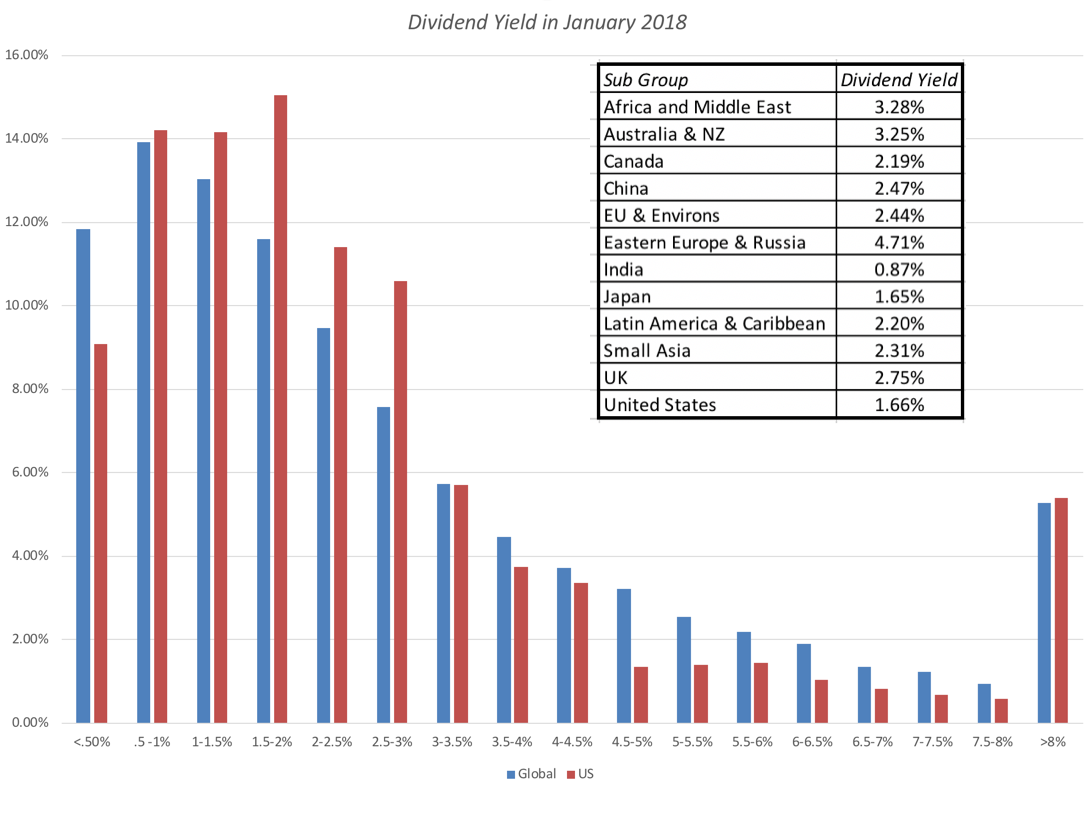
As with the payout distribution, there are outliers, with companies that deliver dividends yields in the double digits. While these companies may attract your attention, if you are fixated on dividends, these are companies that are almost certainly paying far more dividends that they can afford, and it is only a question of when they will cut dividends, not whether. With both measures of dividends, there is a hidden statistic that needs to be emphasized. While these charts look at aggregate dividends paid by companies and present a picture of dividend plenty, the majority of companies in both the US (75.8%) and globally (57.6%) pay no dividends. The median company in the US and globally pays no dividends.
Buybacks
There is a great deal of disinformation out there about stock buybacks and I tried to deal with them in this post from a couple of years ago. The reality is that stock buybacks have largely replaced dividends as the primary mechanism for returning cash to stock holders, at US companies. In 2017, buybacks represented 53.69% of all cash returned by US companies, but the shift to stock buybacks is starting to spread to other parts of the globe, as can be seen in the regional breakdown below:
| Sub Group | Number of firms | Dividends | Dividends + Buybacks | Buybacks as % of Cash Returns |
|---|---|---|---|---|
|
Africa and Middle East
|
2,277
|
$65,767
|
$70,530
|
6.75%
|
|
Australia & NZ
|
1,777
|
$50,194
|
$56,034
|
10.42%
|
|
Canada
|
2,850
|
$49,544
|
$80,470
|
38.43%
|
|
China
|
5,552
|
$317,678
|
$342,282
|
7.19%
|
|
EU & Environs
|
5,399
|
$320,027
|
$514,279
|
37.77%
|
|
Eastern Europe & Russia
|
558
|
$21,761
|
$23,522
|
7.49%
|
|
India
|
3,511
|
$20,701
|
$27,121
|
23.67%
|
|
Japan
|
3,755
|
$101,760
|
$134,087
|
24.11%
|
|
Latin America
|
880
|
$40,395
|
$47,907
|
15.68%
|
|
Small Asia
|
8,630
|
$128,066
|
$148,607
|
13.82%
|
|
UK
|
1,412
|
$101,605
|
$128,161
|
20.72%
|
|
United States
|
7,247
|
$486,009
|
$1,049,487
|
53.69%
|
While US companies still return more cash in the form of buybacks than their global counterparts, European and Canadian companies also return approximately 38% of cash returned in buybacks, and even Indian companies are catching on (with about 24% returned in buybacks). If you are interested in how much cash companies in different countries return, and in what form, you can check this list, or the heat map below (you can see the dividend yield and payout ratios, by country, in the live version of the map):
via chartsbin.com
There are differences in how companies return cash, across sectors, and the table below lists the ten sectors that return the most and the least cash, in the form on buybacks, as a percent of cash returned.
 |
| Download full sector data |
Commodity companies and utilities are still more likely to return cash in the form of dividends, while software and technology companies are more likely to use buybacks. If you are interested, you can download the entire sector list, with dividends, buybacks and associated statistics.
Cash Balance
There is one final loose end to tie up on dividends. If companies don't return their FCFE (potential dividends) to stockholders, it accumulates as a cash balance. One way to measure whether companies are returning enough cash is to look at cash balances, scaled to either the market values of these firms or market capitalization. The table below provides the regional statistics on cash balances:
| Sub Group | Cash Balance | Cash/Firm Value | Cash/ Market Cap |
|---|---|---|---|
|
Africa and Middle East
|
$490,475
|
16.13%
|
24.43%
|
|
Australia & NZ
|
$175,578
|
6.43%
|
11.37%
|
|
Canada
|
$183,204
|
4.66%
|
8.10%
|
|
China
|
$2,724,851
|
12.84%
|
21.16%
|
|
EU & Environs
|
$2,935,769
|
11.85%
|
22.43%
|
|
Eastern Europe & Russia
|
$112,480
|
15.08%
|
24.34%
|
|
India
|
$99,190
|
3.31%
|
4.18%
|
|
Japan
|
$4,185,572
|
34.47%
|
67.73%
|
|
Latin America
|
$239,664
|
7.84%
|
13.06%
|
|
Small Asia
|
$841,230
|
9.91%
|
15.19%
|
|
UK
|
$1,087,286
|
15.80%
|
29.48%
|
|
United States
|
$2,206,548
|
4.73%
|
7.52%
|
Conclusion
If the end game in business, for investors, is the generation and distribution of cash flows to them, many companies and investors seem to be stuck in the past, where long corporate life cycles and stable earnings allowed companies to pay large, steady and sustained dividends. Facing shorter life cycles, global competition and more unpredictable earnings, it should come as no surprise that companies are looking for more flexible ways of returning cash, than paying dividends and that buybacks have emerged as an alternative. As companies take advantage of the new tax law and bring back trapped cash, some will undoubtedly use the cash to buy back stock, and be loudly declaimed by the usual suspects, for not putting the cash to "productive" uses. I would offer two counters, the first being my post on excess returns where I note that more than 60% of global companies destroy value as they try to reinvest and growth, and the second being that it is better for economies, for aging companies to give cash back to stock holders, to invest in better businesses.
YouTube Video
Data Links
- Dividend, Buyback and Cash Balance statistics, by Country
- Dividend, Buyback and Cash Balance statistics, by Sector
Data Update Posts
- January 2018 Data Update 1: Numbers don't lie, or do they?
- January 2018 Data Update 2: The Buoyancy of US Equities!
- January 2018 Data Update 3: Taxing Questions on Value
- January 2018 Data Update 4: The Currency Conundrum
- January 2018 Data Update 5: Country Risk Update
- January 2018 Data Update 6: A Cost of Capital Primer
- January 2018 Data Update 7: Growth and Value - Investment Returns
- January 2018 Data Update 8: Debt and Taxes
- January 2018 Data Update 9: Dividends, Buybacks and Cash Holdings
- January 2018 Data Update 10: The Pricing Prerogative