


Nasdaq Analysis | HASH Invests
Technical Analysis for Agape ATP (Nasdaq: ATPC)

hashinvests
Publish date: Thu, 15 Aug 2024, 05:15 PM
hashinvests
0 6
Welcome to our platform on Nasdaq based companies analysis!
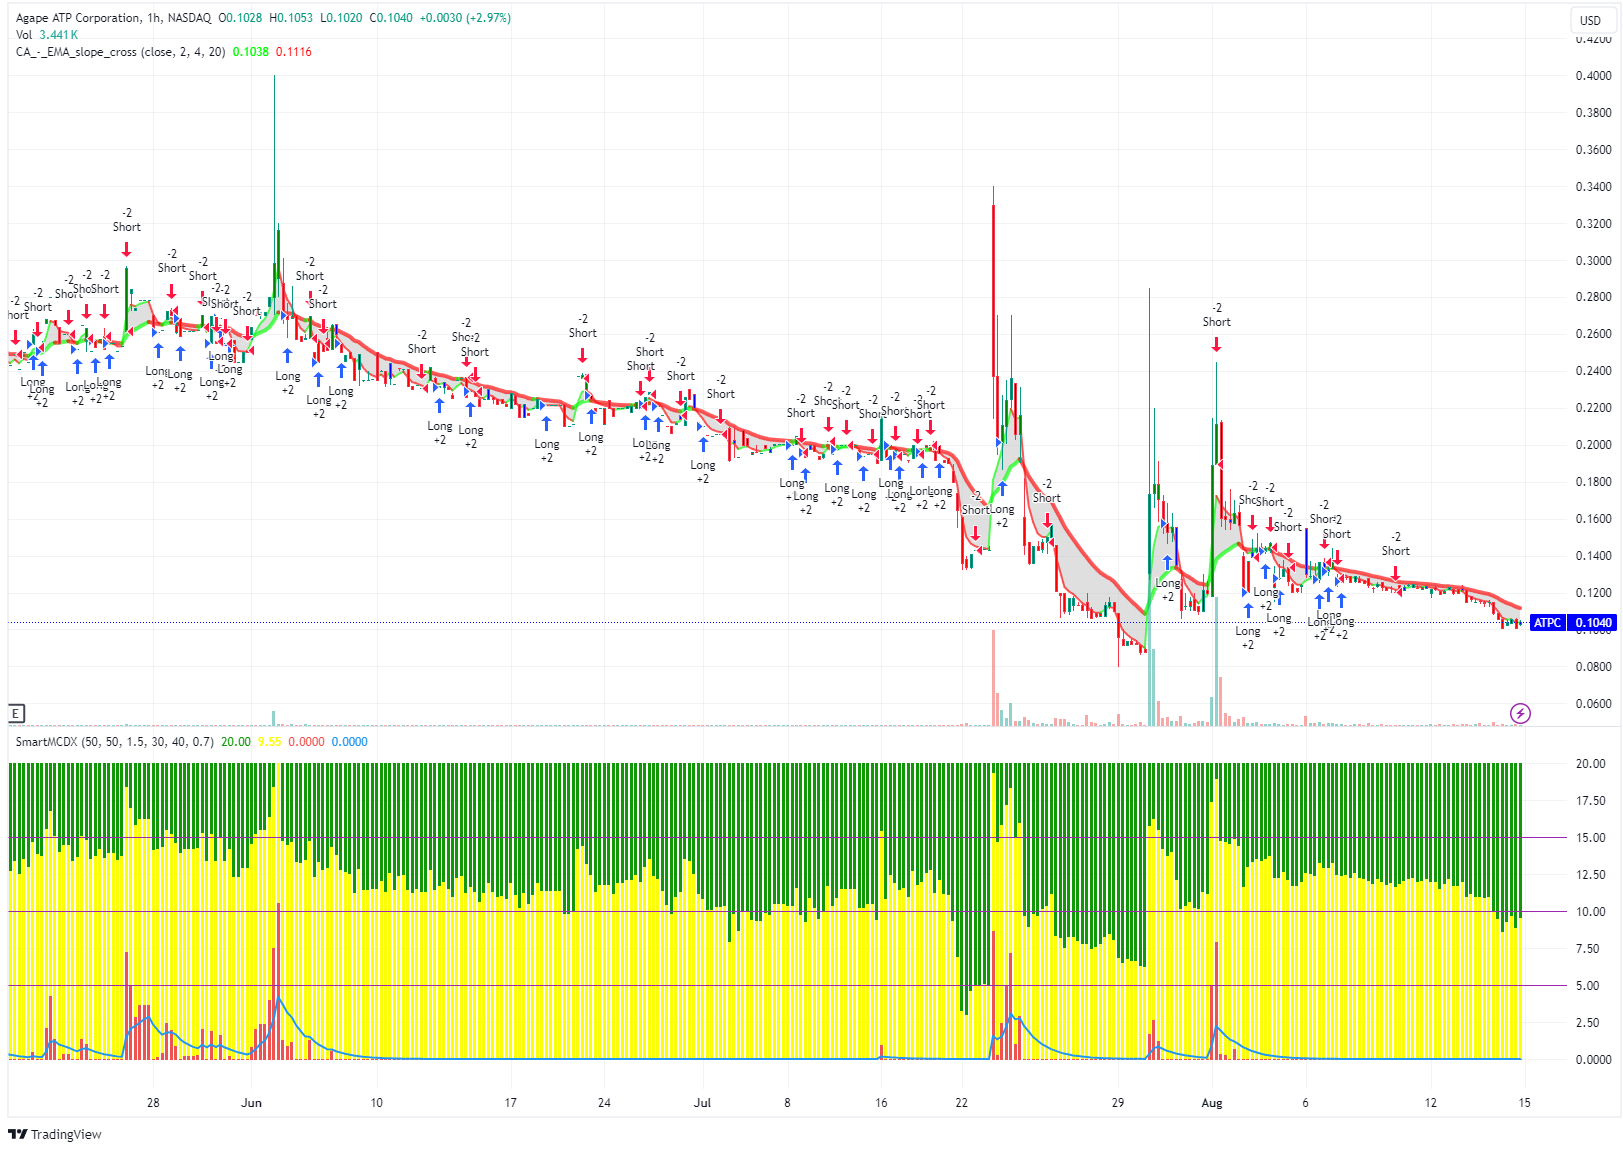
Looking at the chart for ATPC, we can observe several key points that might be of interest to retail investors considering a position in this stock.
Over the past few months, the stock has been on a downward trend with intermittent spikes in both price and volume. The overall trend suggests that the stock is experiencing consistent selling pressure, which has pushed it down to its current levels.
However, one of the more notable observations from the chart is the support level that has formed around the 10 cents mark. The stock price has touched or hovered near this level multiple times, indicating that there is some buying interest at this price point. This level could act as a psychological barrier, where buyers step in, preventing the stock from falling further.
The stock has been trading below its short-term moving averages, which often suggests a bearish sentiment. Nevertheless, the moving averages appear to be flattening out, which might indicate that the downtrend is slowing down and the stock could be finding a base around the current price.
Conclusion:
For investors considering ATPC, the 10 cents support level is a crucial point to watch. If the stock manages to hold above this level, it could suggest that the downside risk is limited in the short term. However, if the price breaks below this level with significant volume, it could signal further declines. As always, it’s essential to consider both technical indicators and broader market conditions before making any investment decisions.
More articles on Nasdaq Analysis | HASH Invests
Reverse Stock Split for Nasdaq: ATPC? What’s the Impact to Shareholders?
Created by hashinvests | Aug 28, 2024
A discussion on ATPC's recent reverse stock split's exercise.
How Malaysia’s National Energy Transition Roadmap (NETR) Can Benefit this Nasdaq Company?
Created by hashinvests | Aug 21, 2024
A study of how National Energy Transition Roadmap will impact ATPC..
NASDAQ: ATPC | Solar Energy Prospects and Share Price’s Volatility | EP02
Created by hashinvests | Aug 16, 2024
Agape ATP Corporation – A NASDAQ Based Company that Deserves More Attention?
Created by hashinvests | Aug 09, 2024
NASDAQ: ATPC | A Deep Dive Analysis on this MALAYSIAN Company | EP01
Created by hashinvests | Aug 04, 2024
Discussions
Be the first to like this. Showing 0 of 0 comments
Post a Comment
Featured Posts
Introducing MY's First IPO Fund for Sophisticated Investors!
New Update. Discover investment communities that resonate with your ideas
M & A Value Partners IPO Equity Fund has been launched - Targeted 13% Return p.a
Latest Videos

.png)


Apps


Top Articles
1
Stock Market Enthusiast
PBBANK: Technical Outlook Suggest Target of RM5 (Uptrend but Overbought) - KingKKK
3
4
save malaysia!
5
M+ Online Research Articles
6
7
TA Sector Research
8
MQ Market Updates
#
Stock
Score
Daily Stocks
Stock Name
Last
Change
Volume
Stock Name
Last
Change
Volume
Stock Name
Last
Change
Volume
MQ Trading Signals
Stock
Time
Signal
Duration
Stock
Time
Signal
Duration
Featured Advertisers / Partners


Ride The Bull Short The Bear
CS Tan
4.9 / 5.0
This book is the result of the author's many years of experience and observation throughout his 26 years in the stockbroking industry. It was written for general public to learn to invest based on facts and not on fantasies or hearsay....