


HLBank Research Highlights
Traders Brief - Persisting geopolitical tensions could cap upside

MARKET REVIEW
Asia’s stock markets ended mostly on a positive note, taking cues from positive overnight Wall Street performance as investors shrugged off tensions in the Middle East. Shanghai Composite Index and Hang Seng Index gained 0.69% and 0.34%, respectively, while Nikkei 225 advanced 1.60%.
Similarly, the FBM KLCI quickly rebounded after the opening bell and ended in positive territory; the key index rose 0.83% to 1,611.04 pts. Market breadth was positive with 441 advancers as compared to 388 decliners, while market traded volume stood at 2.99bn (worth RM1.80bn). Plantation (TDM and RSAWIT) and steel-related (MYCRON and MELEWAR) stocks were traded actively higher for the session.
Following the killing of the top Iranian military leader which has triggered a dramatic escalation of tensions in the region, market volatility has increased and selling pressure has returned to the market led by energy stocks. The Dow and S&P500 dropped 0.42% and 0.28%, respectively while Nasdaq (-0.03%) trended flat.
TECHNICAL OUTLOOK: KLCI
The FBM KLCI has recouped most of the losses on Monday, forming a solid rebound with a bullish candle. The MACD Histogram has improved yesterday, in tandem with the MACD Line (hovering above zero). Meanwhile, both the RSI and Stochastic oscillators have hooked upwards. The trading range of the FBM KLCI is likely to trend between 1,580-1,620 over the near term.
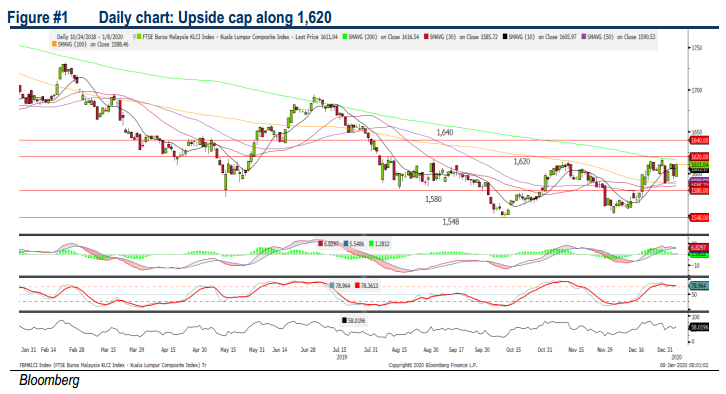
Although technicals on FBM KLCI are fairly positive, breaking news this morning stating that rockets were fired at an Iraqi airbase that hosted US troops could send equities on a lower note. Also, despite market participants are focusing on the Phase 1 trade deal, the heightened US-Iran tensions would put pressure on the upside on FBM KLCI for now. The FBM KLCI’s resistance is located around 1,620. Nevertheless, traders may lookout for safe haven asset (gold and Japanese yen) for alternative trading opportunities.
TECHNICAL OUTLOOK: DOW JONES
The Dow has been hovering sideways over the past two weeks and the MACD indicator has performed a negative cross (MACD Line below Signal Line). Meanwhile, both the RSI and Stochastic oscillators are pointing downwards. Hence we opine that the Dow could be negative bias on the short term with resistance set along 29,000. Support is anchored around 28,000.
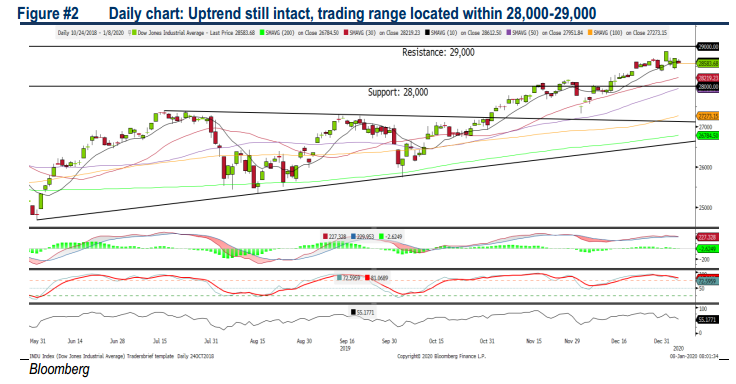
Following the airstrike in Baghdad last Friday, most of the market participants are having further concerns the tensions may persist and it could dampened the risk appetite for equities moving forward. Also, with the US defence official stating that Iran’s military is displaying “heightened state of readiness”, coupled with the breaking news that the Iraqi airbase (hosting US troops) is fired with missile attacks may cap upside on Wall Street and investors would look into safe haven assets. The Dow’s trading range will be located around 28,000-29,000 and the Dow futures are plunging more than 250 points (at the point of writing).
TECHNICAL TRACKER: TUNEPRO
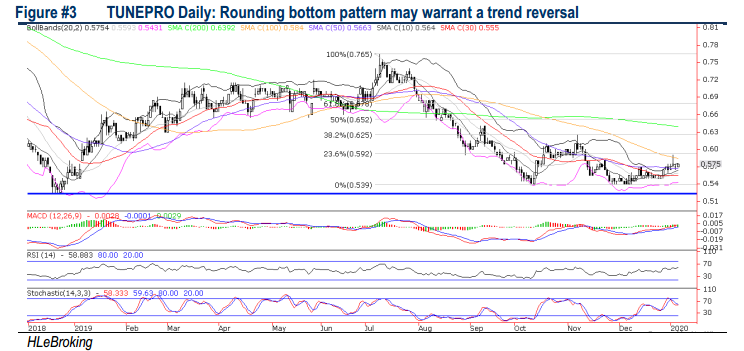
A good proxy to VMY and attractive dividend yield. We remain positive on TUNEPRO, premised on the group’s continued focus on rationalisation of business composition (to more profitable non-motor segments) as well as harness new digital partnerships & improve sustainability of existing portfolios. Also, TUNEPRO could be one of the beneficiaries from Visit Malaysia Year (VMY) 2020 campaign as the government targets to bring in 30m international tourist arrivals, while it is an alternative proxy to participate in AirAsia’s strong growth story without exposures to jet fuel price and USD borrowings risks. Valuations are undemanding at 8x FY20 P/E (45% below peers and 28.6% below 2Y historical average of 11.2x) and 0.79x P/B (69% lower than its peers and 28.2% below 2Y historical average of 1.1x), supported by a stable 7% FY18-21 EPS CAGR, attractive FY20 dividend yield of 5.6% (54% higher than its peers). Overall, the stock is ripe for a LT downtrend reversal and heading towards RM0.60- 0.71 levels after forming a saucer bottom pattern.
Source: Hong Leong Investment Bank Research - 8 Jan 2020
More articles on HLBank Research Highlights
Discussions
Be the first to like this. Showing 0 of 0 comments
Post a Comment
Featured Posts


Latest Videos


Apps


Top Articles
1
3
4
BFM Podcast
6
BFM Podcast
7
BFM Podcast
8
#
Stock
Score
Daily Stocks
Stock Name
Last
Change
Volume
Stock Name
Last
Change
Volume
Stock Name
Last
Change
Volume
MQ Trading Signals
Stock
Time
Signal
Duration
Stock
Time
Signal
Duration
Featured Advertisers / Partners


Ride The Bull Short The Bear
CS Tan
4.9 / 5.0
This book is the result of the author's many years of experience and observation throughout his 26 years in the stockbroking industry. It was written for general public to learn to invest based on facts and not on fantasies or hearsay....