


Kenanga Research & Investment
Daily Technical Highlights - (ALAM, ICON)

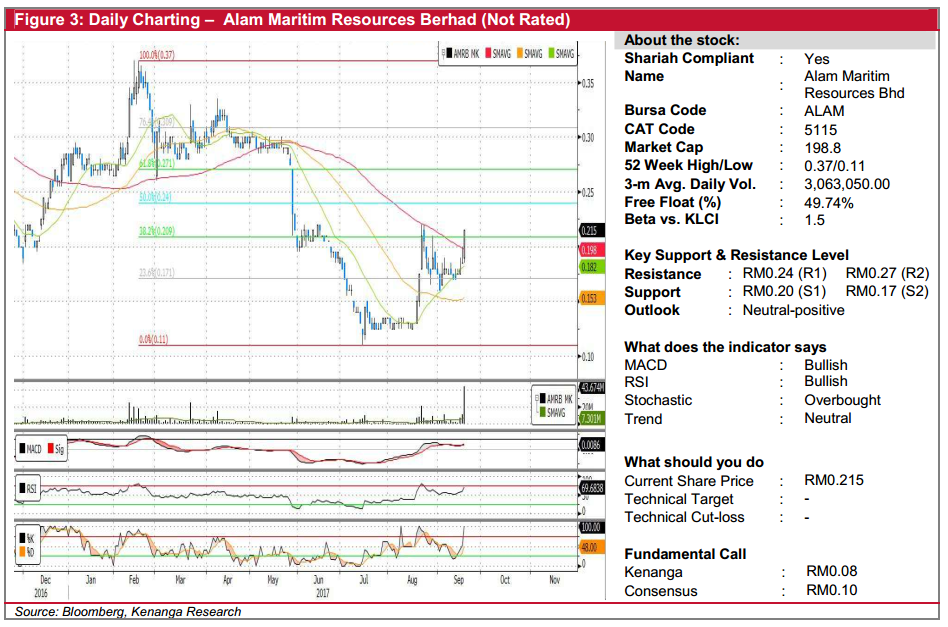
ALAM (Not Rated). O&G counters rallied on Wednesday including ALAM, which climbed 3.0 sen (16.2%) to RM0.215. From a charting perspective, yesterday’s bullish move resulted in a breakout above the 100-day SMA – a feat last seen in December 2016. Earlier last month, ALAM’s 20-day SMA had also completed a “Golden Crossover” with the 50-day SMA. Taken together with the key momentum indicators which have turned positive, we believe the share price has bottomed out after a half-year long downtrend, and is now poised for a strong recovery. From here, immediate resistance levels to look out for are RM0.24 (R1) and RM0.27 (R2). Meanwhile, downside support levels are RM0.20 (S1) and RM0.17 (S2) where investors are likely to buy on weakness.
![]()
ICON (Not Rated). Yesterday, ICON gained 4.5 sen (18.75%) to close at RM0.285 forming a“white-Marubozu” candlestick, reflecting that buyers were in control throughout the trading session. Chart-wise, the share price had just broken out of its four-month sideways consolidation potentially signalling the price has bottomed out. The movement was supported by strong trading volume of 23.3m shares traded compared to its SMAVG (20) of 2.6m shares. Key indicators are also showing positive signs of momentum gain with MACD line starting to cross above both the Signal and zero lines. Hence, the price could potentially trend higher towards key psychological level of RM0.300 (R1) or further up at RM0.345-RM0.350 (R2) where key psychological level and 50% Fibonacci Retracement level coincides. Conversely, support levels can be found at the previously resistance-turned support level of RM0.250 (S1) or RM0.200 (S2) below.
Source: Kenanga Research - 21 Sept 2017
Related Stocks
| Chart | Stock Name | Last | Change | Volume |
|---|
More articles on Kenanga Research & Investment
Discussions
Be the first to like this. Showing 0 of 0 comments
Post a Comment
Featured Posts


Latest Videos


Apps


Top Articles
1
2
3
Koon Yew Yin's Blog
4
THE INVESTMENT APPROACH OF CALVIN TAN
5
save malaysia!
7
8
CEO Morning Brief
#
Stock
Score
Daily Stocks
Stock Name
Last
Change
Volume
Stock Name
Last
Change
Volume
Stock Name
Last
Change
Volume
Featured Advertisers / Partners


Ride The Bull Short The Bear
CS Tan
4.9 / 5.0
This book is the result of the author's many years of experience and observation throughout his 26 years in the stockbroking industry. It was written for general public to learn to invest based on facts and not on fantasies or hearsay....