


Kenanga Research & Investment
Daily Technical Highlights - (GCB, MUDAJYA)

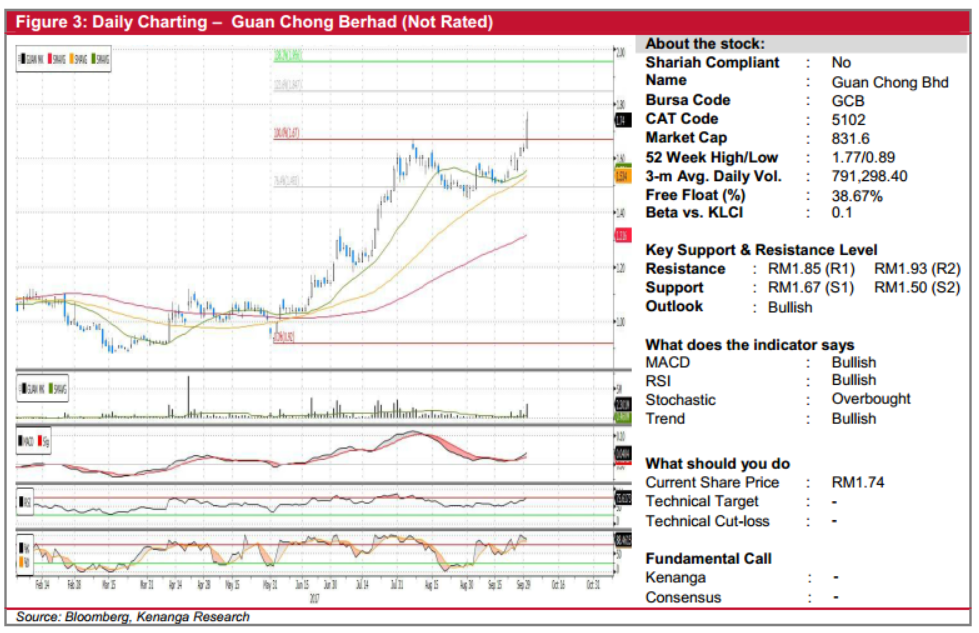
GCB (Not Rated). GCB rallied yesterday to a four-year high of RM1.74 after the share price gained 10 sen (6.1%) following an announcement last week that it will be making an asset acquisition for US$8.4m (RM35.5m) to achieve organic expansion on existing business operations. From a charting perspective, the GCB kicked off an uptrend in June and has since climbed from RM1.10 to as high as RM1.67 before pulling back. Nevertheless, yesterday’s bullish move resulted in a breakout above its August high, potentially signalling that the share price is poised for the next leg of its rally after a healthy pause. Key momentum indicators have also hooked upwards to reflect this shift to bullish sentiment. From here, expect further gains towards next resistance levels RM1.85 (R1) and RM1.93 (R2). Any weakness towards RM1.67 (S1) may be viewed as a buying opportunity, although a further break below RM1.50 (S2) would be highly negative.
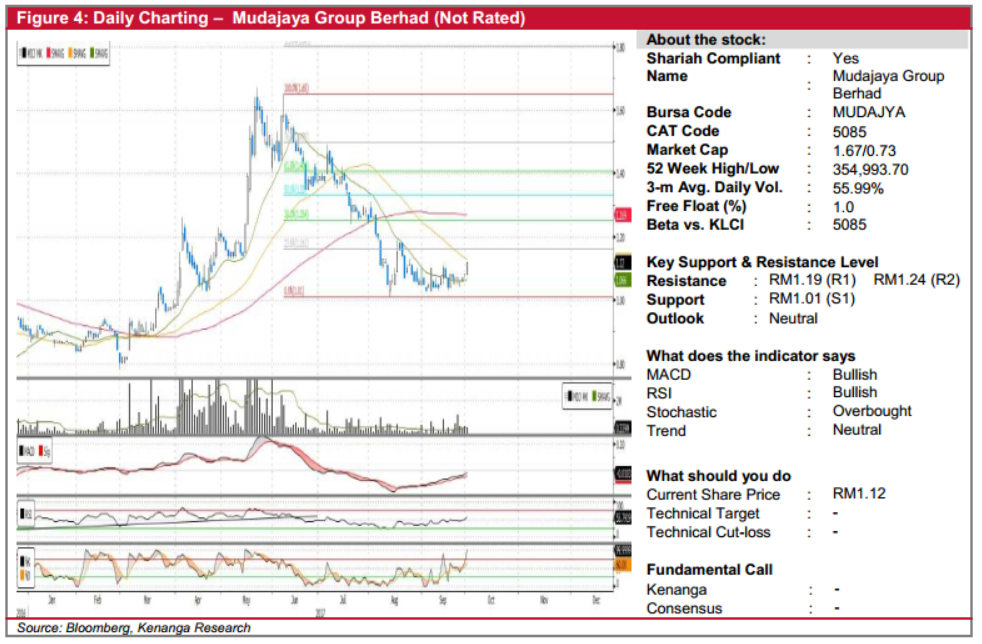
MUDAJYA (Not Rated). MUDAJYA gained 4 sen (3.7%) yesterday to close at RM1.12, bucking the trend to stage a significant break-above from its downward consolidation trend since early-June. Coupled with positive uptrends in keyindicators since its low on 11-Aug, yesterday’s move may potentially be indicative of a larger reversal play. Another encouraging note is the weak trading volumes during its downtrend, as compared to strong volumes during its prior uptrend from Feb to May, thus suggesting more a positively biased sentiment as an underlying support for the share. From here, sustained momentum would see the share move towards its overhead resistances at RM1.19 (R1) and RM1.24 (R2). Conversely, a firm support can be found at its low of RM1.01 (S1).
Source: Kenanga Research - 3 Oct 2017
Related Stocks
| Chart | Stock Name | Last | Change | Volume |
|---|
More articles on Kenanga Research & Investment
Discussions
Be the first to like this. Showing 0 of 0 comments
Post a Comment
Featured Posts
Introducing MY's First IPO Fund for Sophisticated Investors!
New Update. Discover investment communities that resonate with your ideas
M & A Value Partners IPO Equity Fund has been launched - Targeted 13% Return p.a
Latest Videos


Apps


Top Articles
1
2
3
Koon Yew Yin's Blog
4
THE INVESTMENT APPROACH OF CALVIN TAN
5
save malaysia!
7
8
CEO Morning Brief
#
Stock
Score
Daily Stocks
Stock Name
Last
Change
Volume
Stock Name
Last
Change
Volume
Stock Name
Last
Change
Volume
Featured Advertisers / Partners


Ride The Bull Short The Bear
CS Tan
4.9 / 5.0
This book is the result of the author's many years of experience and observation throughout his 26 years in the stockbroking industry. It was written for general public to learn to invest based on facts and not on fantasies or hearsay....