


Kenanga Research & Investment
Daily Technical Highlights – (WCT, SASBADI)

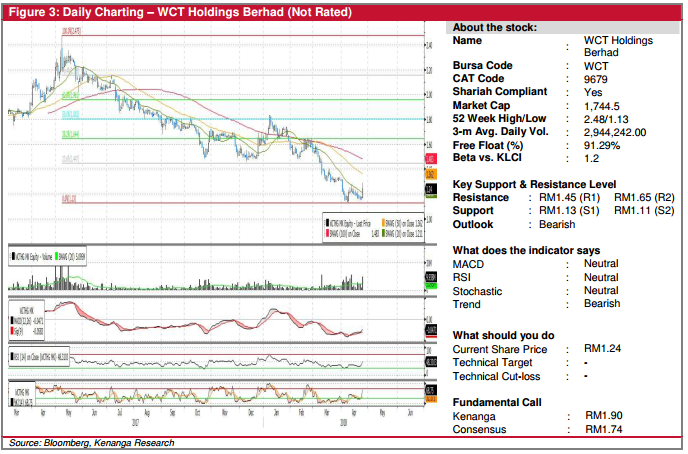
WCT (Not Rated)
Yesterday, WCT caught our attention after it closed the day higher by 7 sen (6.0%) at RM1.24, backed by high trading volumes of almost double its 20-day average.
Chart-wise, the share’s downtrend since May last year is still firmly intact. Despite so, its MACD indicator has shown signs of a bullish divergence for a large part of the month, signalling a gradual slowdown in downside momentum.
Keen investors may visit the share should it be able to break past resistance of RM1.45 (R1). That said, decisively closing above RM1.65 (R2) should be a more convincing sign that the share has broken out of its downtrend line.
Nonetheless, foreseeable downside from here is fairly limited, with strong immediate support at RM1.13 (S1). However, a break below it will be highly devastating, with follow-through sell-down likely taking out its all-time low at RM1.11 (S2).
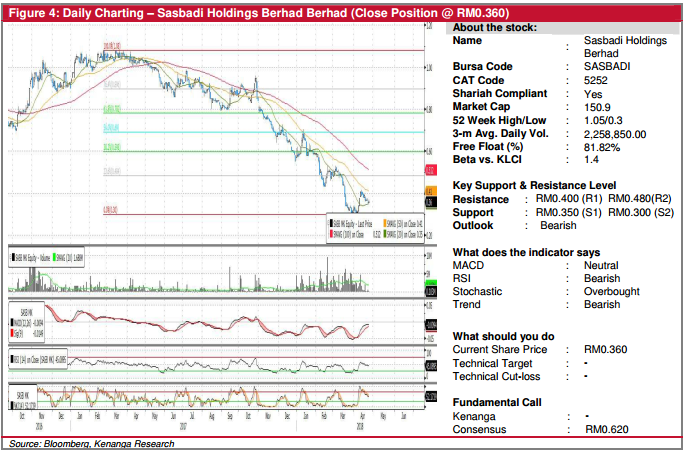
SASBADI (Close Position @ RM0.360)
Following our “Trading Buy’ call issued on 12 April 2018, SASBADI has failed to sustain buying interest which saw the share down trending since then.
Momentum indicators are tapering off with MACD in negative territory while RSI and Stochastic in downwards movement.
With indicators reading leaning towards bearish outlook, we decide to close position.
Traders could consider selling on any near-term strength towards RM0.400 (R1) and RM0.480 (R2).
Conversely immediate support levels are seen at RM0.350 (S1) and RM0.300 (S2) further down.
Source: Kenanga Research - 25 Apr 2018
Related Stocks
| Chart | Stock Name | Last | Change | Volume |
|---|
More articles on Kenanga Research & Investment
Discussions
Be the first to like this. Showing 0 of 0 comments
Post a Comment
Featured Posts


Latest Videos


Apps


Top Articles
1
2
THE INVESTMENT APPROACH OF CALVIN TAN
3
4
save malaysia!
5
Koon Yew Yin's Blog
7
8
CEO Morning Brief
#
Stock
Score
Daily Stocks
Stock Name
Last
Change
Volume
Stock Name
Last
Change
Volume
Stock Name
Last
Change
Volume
Featured Advertisers / Partners


Ride The Bull Short The Bear
CS Tan
4.9 / 5.0
This book is the result of the author's many years of experience and observation throughout his 26 years in the stockbroking industry. It was written for general public to learn to invest based on facts and not on fantasies or hearsay....