Daily technical highlights – (MISC, BURSA)
kiasutrader
Publish date: Thu, 25 Oct 2018, 08:59 AM
MISC (Not Rated)

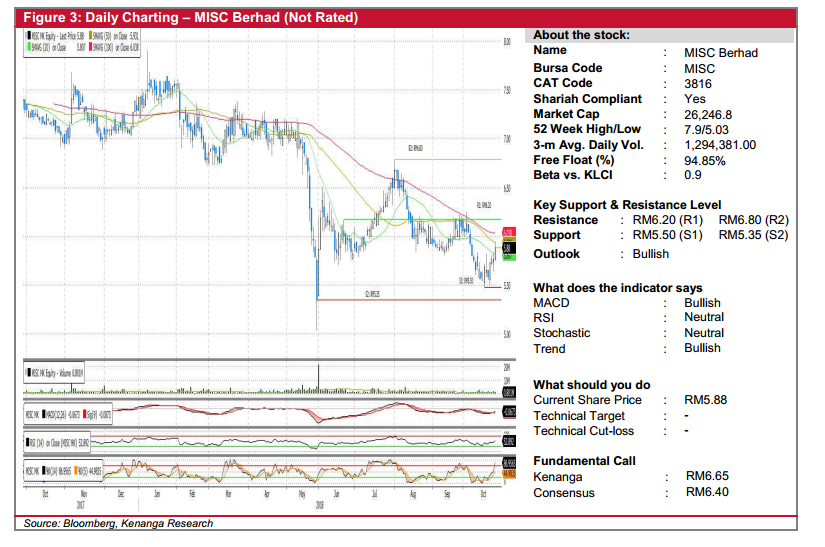
• MISC climbed 12.0 sen (+2.08%) to end at RM5.88.
• Chart-wise, the share was on a downtrend since August 2018. However, yesterday’s move saw the share crossed above the 20-day SMA.
• Coupled with the crossing of the MACD line above the signal line, we think that the share may be staging a short-term rebound.
• Continuous positive momentum will see resistance at RM6.20 (R1) and RM6.80 (R2).
• Should momentum taper-off, downside support can be identified at RM5.50 (S1) and RM5.35 (S2)
BURSA (Not Rated)

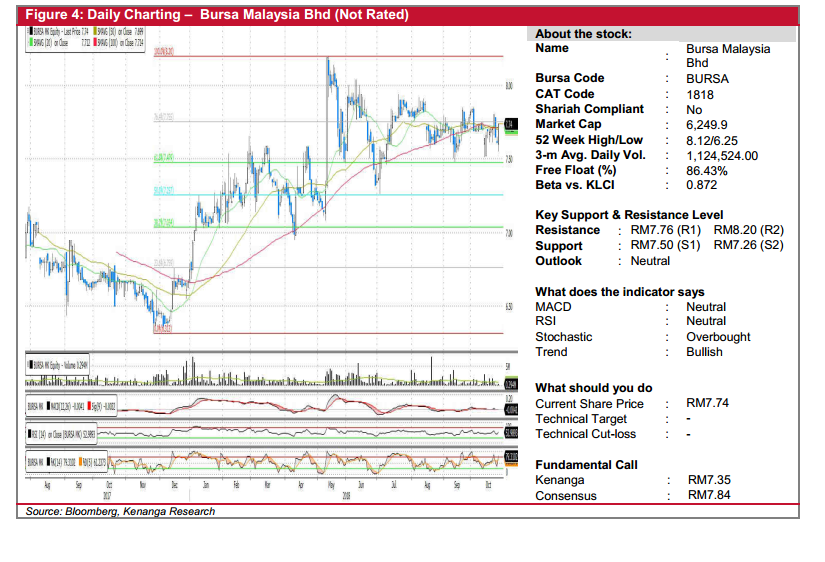
• BURSA gained 13.0 sen (+1.71%) to close at RM7.74 yesterday.
• Yesterday’s bullish candlestick saw it broke past key SMAs, possibly indicating a continued bullish move ahead.
• Moreover, encouraging momentum readings are indicated by meaningful upticks in the RSI and stochastic
• We look towards RM7.76 (R1) as immediate resistance with a decisive breakout will see the share advancing towards RM8.20 (R2).
• Conversely, immediate support can be at RM7.50 (S1), and further down at RM7.26 (S2).
Source: Kenanga Research - 25 Oct 2018
Related Stocks
| Chart | Stock Name | Last | Change | Volume |
|---|
Market Buzz
2024-11-26
MISC2024-11-26
MISC2024-11-26
MISC2024-11-25
MISC2024-11-25
MISC2024-11-25
MISC2024-11-25
MISC2024-11-22
BURSA2024-11-22
BURSA2024-11-22
MISC2024-11-22
MISC2024-11-22
MISC2024-11-21
BURSA2024-11-21
BURSA2024-11-21
MISC2024-11-21
MISC2024-11-21
MISC2024-11-20
BURSA2024-11-20
MISC2024-11-20
MISC2024-11-20
MISC2024-11-20
MISC2024-11-19
BURSA2024-11-19
MISC2024-11-19
MISC2024-11-18
BURSA2024-11-18
MISC2024-11-18
MISC


