


Kenanga Research & Investment
Daily technical highlights – (SENDAI, PADINI)

SENDAI (Not Rated)
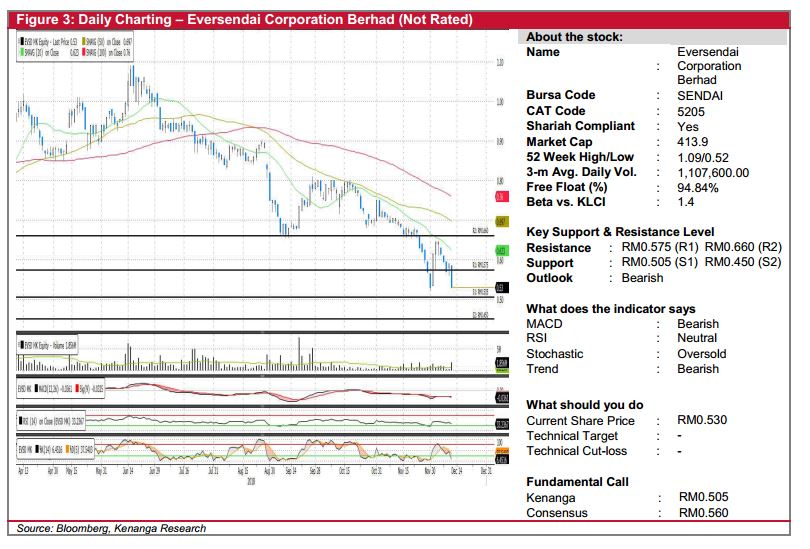
• SENDAI slipped 6.0 sen (-10.17%) yesterday to close at RM0.530.
• Chart-wise, the share has been on a decline since breaking below its 100-days in mid-July 2018. Yesterday’s candlestick close to form a long bearish candlestick.
• Given that the shorter term SMAs are trading below the longer-term SMAs and coupled with lacklustre signals from key momentum indicators, we believe that there may be a further downside risk.
• Supports can be identified at RM0.505 (S1) and RM0.450 (S2). Conversely, we observe resistance levels at RM0.575 (R1) and RM0.660 (R2).
PADINI (Close Position @ RM3.80)
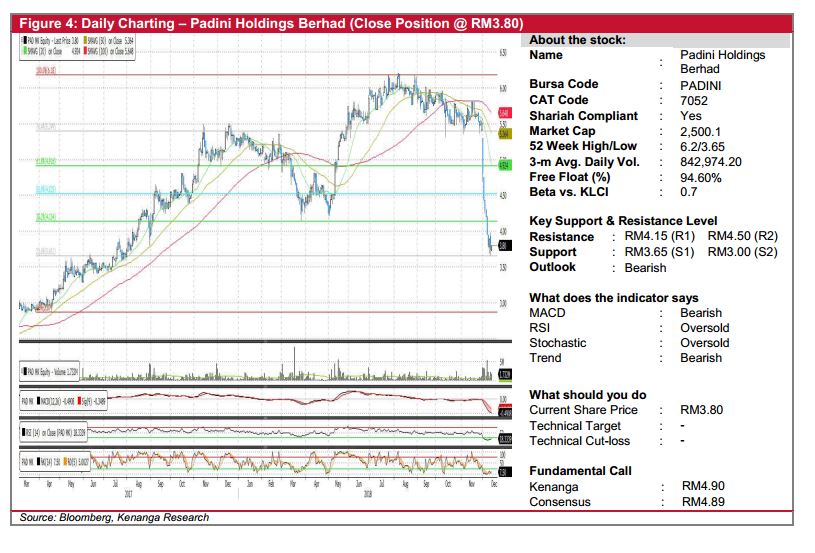
• We are bringing a closure to our ‘Trading Buy’ call on PADINI in view of the recent dip in price.
• Since our ‘Trading Buy’ call on 18 May 2018, the share rallied and hit a high of RM6.20. However, the share plunged since the start of December following the disappointment in its quarterly result coupled with an overall negative global sentiment.
• Overall technical outlook is bearish as it has broken below the RM4.10 support level and momentum indicators are all negative with no sign of a reversal.
• From here, the share may continue to plunge to its support levels at RM3.65 (S1) and RM3.00 (S2). Should there be a positive change in sentiment for PADINI, resistances can be found at RM4.15 (R1) and RM4.50 (R2)
Source: Kenanga Research - 13 Dec 2018
Related Stocks
| Chart | Stock Name | Last | Change | Volume |
|---|
More articles on Kenanga Research & Investment
Discussions
Be the first to like this. Showing 0 of 0 comments
Post a Comment
Featured Posts


Latest Videos


Apps


Top Articles
2
3
4
5
save malaysia!
6
THE INVESTMENT APPROACH OF CALVIN TAN
7
Koon Yew Yin's Blog
8
Good Articles to Share
Le Pen makes new threat to withdraw support for French government
#
Stock
Score
Daily Stocks
Stock Name
Last
Change
Volume
Stock Name
Last
Change
Volume
Stock Name
Last
Change
Volume
Featured Advertisers / Partners


Ride The Bull Short The Bear
CS Tan
4.9 / 5.0
This book is the result of the author's many years of experience and observation throughout his 26 years in the stockbroking industry. It was written for general public to learn to invest based on facts and not on fantasies or hearsay....