


Kenanga Research & Investment
Daily Technical Highlights – (FGV, OCK)

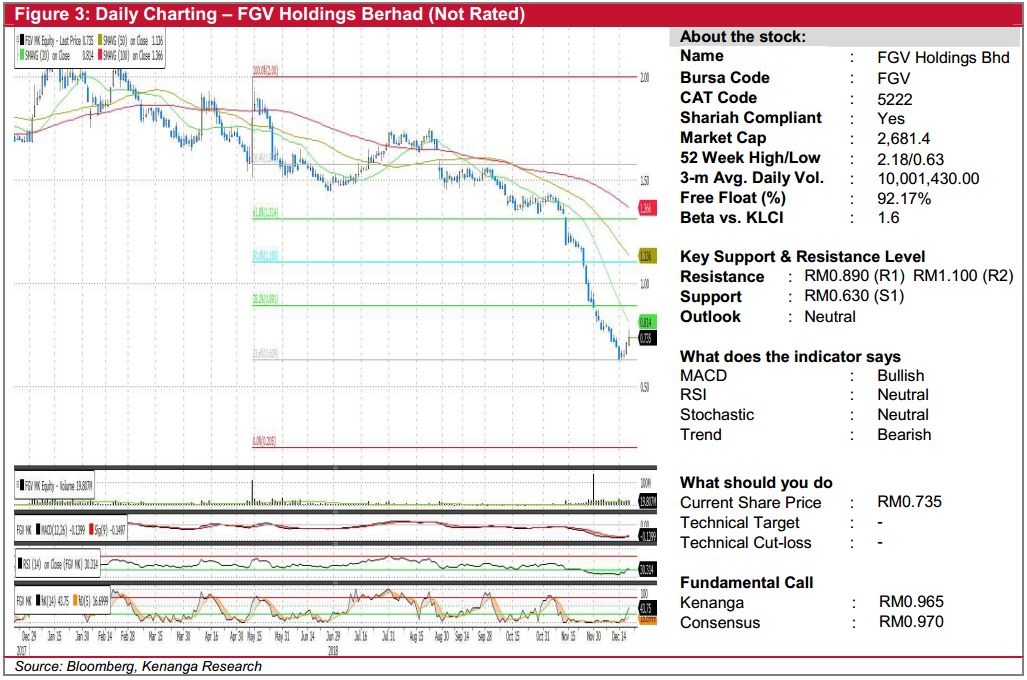
FGV (Not Rated)
- Yesterday, FGV went up 2.5 sen (+3.52%) to close at RM0.735.
- Chart-wise, the share seems to be recovering from its downtrend that started a month ago, noting the four consecutive bullish candle sticks. Additionally, yesterday’s candlestick displayed an inverted hammer which could signify the emergence of buying interest.
- Key momentum indicators continue to show positive upticks coupled with a bullish MACD crossover occurrence.
- Should buying momentum continue, we expect the share to test resistances at RM0.890 (R1) and RM1.100 (R2)
- Conversely, downside support can be found at RM0.630 (S1).
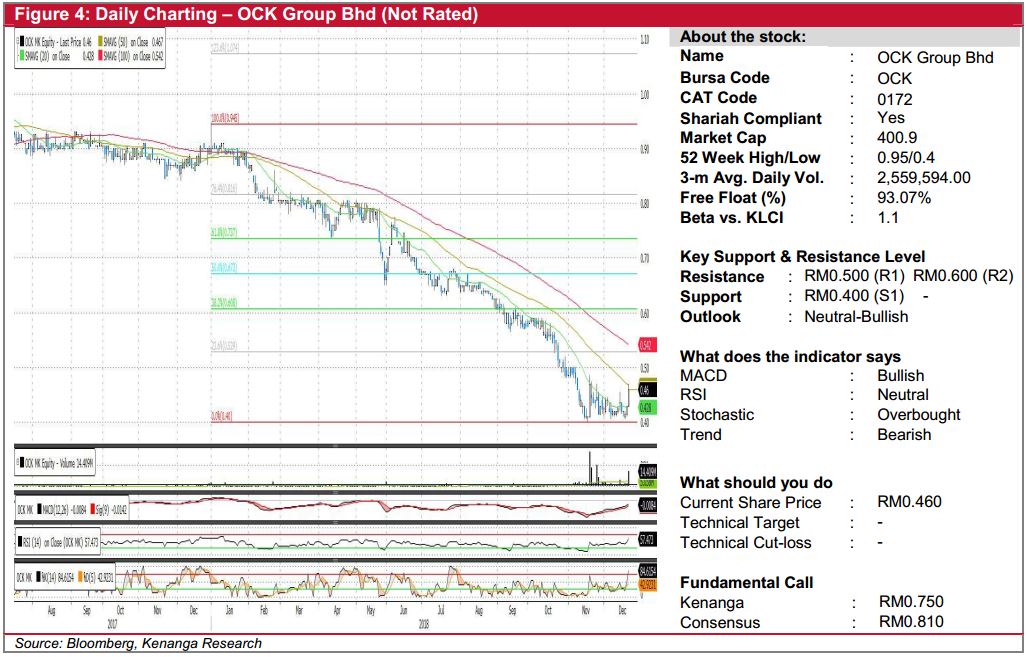
OCK (Not Rated)
- OCK grew by 3.0 sen (+6.98%) to close at RM0.460 yesterday on the back of higher-than-average trading volume with 13.3m shares exchanging hand-almost 3 fold to its 20-day average.
- Technically, yesterday’s bullish candlestick could suggest a downtrend reversal as the share appears to have bottomed out.
- Momentum indicators appears leaning towards the upside with bullish MACD crossover while other oscillators showing upticks.
- From here, should buying interest be sustained, we expect next advancement towards RM0.500 (R1) and RM0.600 (R2) next.
- Conversely, support level to watch out for can be found at RM0.400 (S1), where a break below is deemed negative.
Source: Kenanga Research - 21 Dec 2018
Related Stocks
| Chart | Stock Name | Last | Change | Volume |
|---|
Market Buzz
More articles on Kenanga Research & Investment
Discussions
Be the first to like this. Showing 0 of 0 comments
Post a Comment
Featured Posts
Introducing MY's First IPO Fund for Sophisticated Investors!
New Update. Discover investment communities that resonate with your ideas
M & A Value Partners IPO Equity Fund has been launched - Targeted 13% Return p.a
Latest Videos


Apps


Top Articles
2
save malaysia!
3
4
5
Koon Yew Yin's Blog
6
7
THE INVESTMENT APPROACH OF CALVIN TAN
8
Good Articles to Share
Le Pen makes new threat to withdraw support for French government
#
Stock
Score
Daily Stocks
Stock Name
Last
Change
Volume
Stock Name
Last
Change
Volume
Stock Name
Last
Change
Volume
Featured Advertisers / Partners


Ride The Bull Short The Bear
CS Tan
4.9 / 5.0
This book is the result of the author's many years of experience and observation throughout his 26 years in the stockbroking industry. It was written for general public to learn to invest based on facts and not on fantasies or hearsay....